
GBPCHF has formed higher lows connected by a rising trend line that’s been holding since early August, and the pair is currently testing this support zone after pulling back from the recent highs near 1.1011.
The trend line coincides with the 38.2% Fibonacci retracement level at 1.0965, which might be enough to attract bullish momentum given that price is hovering right around this area at 1.0982.

A larger correction could still reach the 50% Fib at 1.0950 or the 61.8% level at 1.0935, which lines up closer to the 100 SMA dynamic support and could be the line in the sand for a bullish pullback.
If any of these hold as a floor, GBPCHF could resume the rally toward the swing high at 1.1011 or higher. A break below the Fibs, on the other hand, could set off a deeper drop toward the swing low or lower.
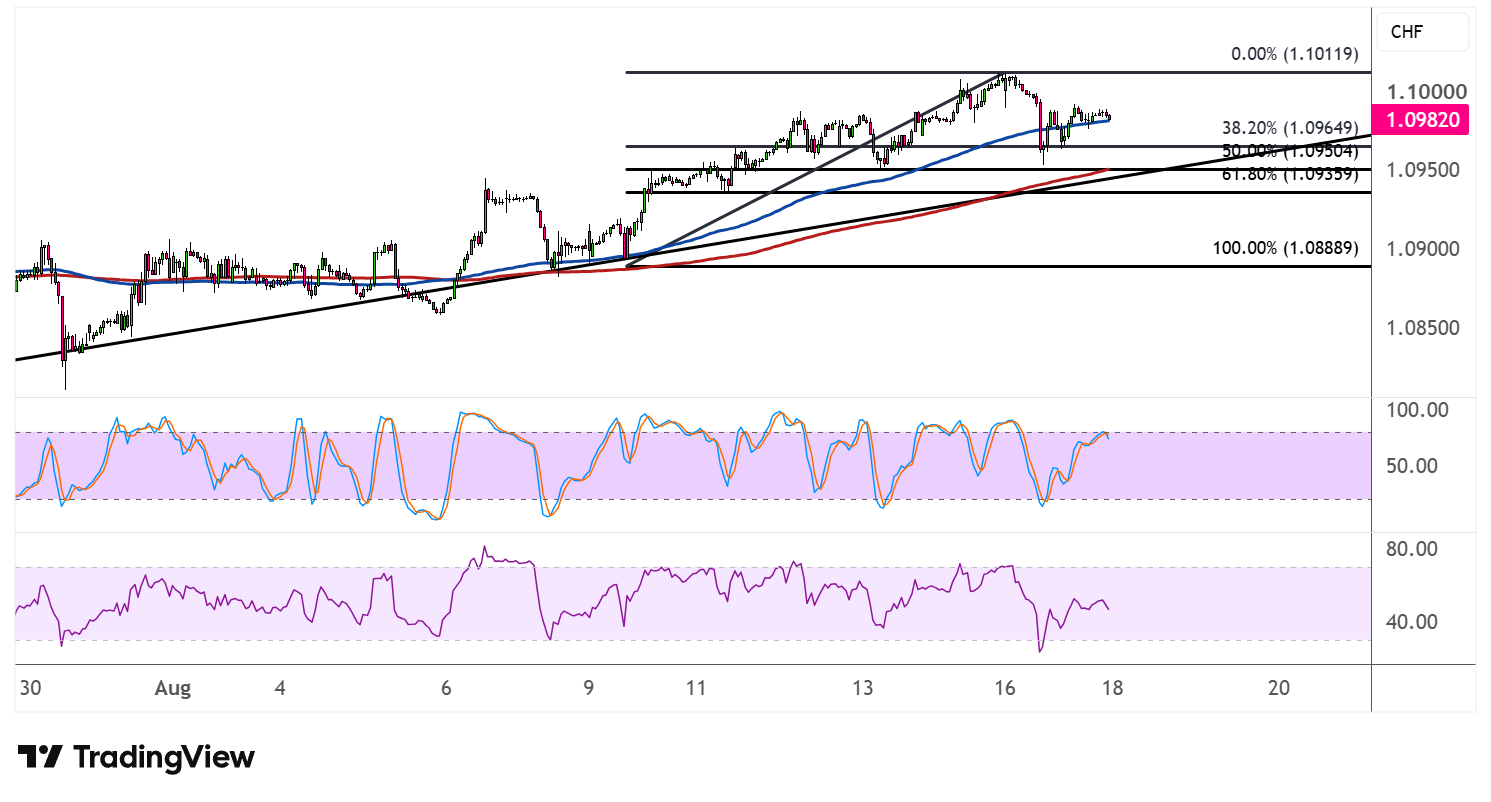
The 100 SMA is above the 200 SMA to confirm that the path of least resistance is to the upside, or that the climb is more likely to gain traction than to reverse. Price is also holding above both moving averages for now, which could reinforce their role as dynamic support on dips.
Stochastic has pulled back from the overbought zone and is hovering in the mid-range, reflecting a cooling off in bullish momentum rather than a full reversal. The oscillator still has room to slide before reaching oversold territory, meaning the pullback could continue a bit further before buyers step back in with conviction.
RSI, meanwhile, has room to fall before hitting oversold levels, so price could keep drifting lower in the near term while the correction plays out. Still, as long as the ascending trend line and the Fibonacci support zone remain intact, the broader uptrend structure stays favorable for GBPCHF, with dip buyers likely to eye these levels as an opportunity to rejoin the climb.