
Natural gas appears to be carving out a double bottom chart pattern on the daily time frame, with price testing the neckline resistance near the $2.95-$3.00 area after bouncing off matching lows around $2.65 in late July and mid-August.
A decisive close above this ceiling could confirm the reversal pattern and set the stage for a rally of the same height as the formation, roughly matching the distance from the bottoms to the neckline.

Price recently staged a sharp rebound from the $2.70 region, closing near $2.784 and climbing back above the 100 SMA dynamic inflection point for the first time in weeks.
However, the 200 SMA is still above the 100 SMA and both remain in a downward slope, keeping the broader path of least resistance tilted to the downside until the shorter-term average can cross back above the longer-term one.
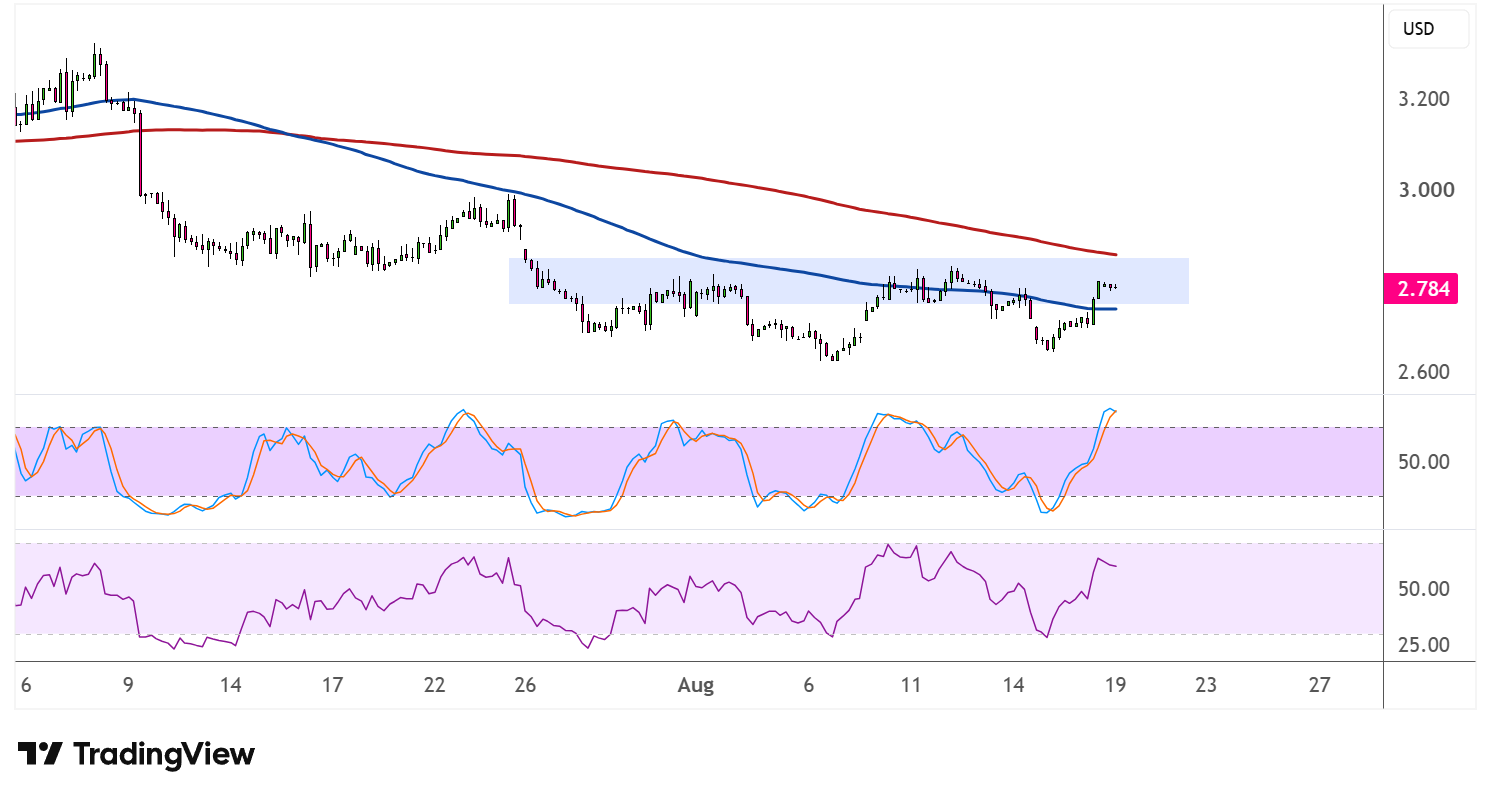
If the neckline holds as resistance, natural gas could still be in for one more leg down to retest the $2.65 support or lower before buyers can regroup.
On the other hand, a clean break above the neckline could open the door for a climb toward $3.20 or higher, in line with a measured move projection from the pattern’s height.
Stochastic has surged sharply higher and is now testing the overbought zone, reflecting the strength of the recent bounce, though this could also mean bullish momentum is due for a breather.
RSI, meanwhile, has room to climb before reaching overbought territory, suggesting price could still follow through to the upside while buyers remain in control.
A continuation of this momentum could help fuel the breakout attempt, while a rejection at current levels would keep the range-bound double bottom pattern intact for now.
Natural gas appears to be finding some support from rising demand as European nations have been reporting heatwaves, though dollar direction from the FOMC minutes could still dictate volatility.