
DIS Long-term outlook
Sell in May and stay in the holiday is a big success in DIS share prices. The weakness of DIS persists as the company reported worse than expected earnings result. Fortunately, the company gets an upgrade from Well’s Fargo this month. Rating upgraded from “Market Perform” to “Outperform.”
The upgrade from Well’s Fargo comes after the company decided to bring its cable content online. Basically, it changed the cable subscription to direct-to-customer streaming. The consequence of this decision bring Disney to terminate distribution agreement with Netflix, and the company will distribute by itself.

The success in the movie is crucial for the company as it losses subscribers in ESPN which lagged the company earnings. Meanwhile, the Disney-Netflix agreement termination will happen in 2019 which may not influence current share prices big time.
Click here to see DIS May analysis
New Month
Monthly chart
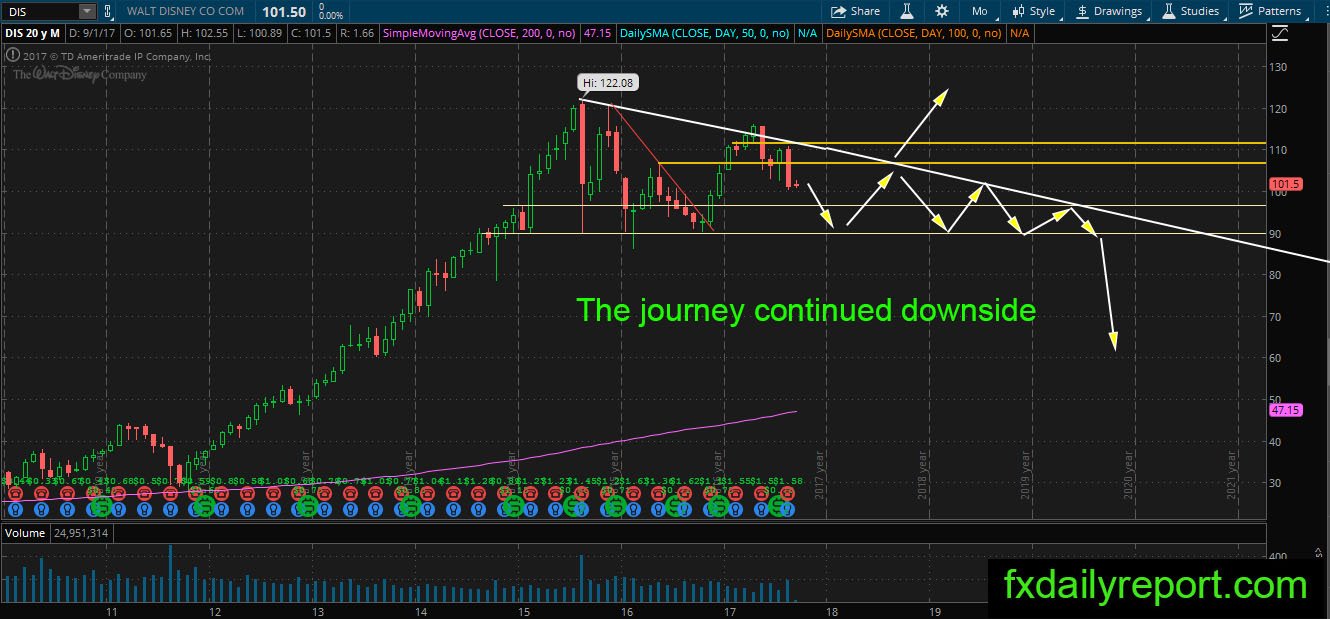
DIS on the monthly chart is under pressure after the share prices closed August as a bearish engulfing pattern. There is more room downside and overall share prices already erased 50% of the previous rally from $90.32 to $116.1. If the bearish pressure continues, we could expect the share prices hit $90 again this year.
Weekly chart
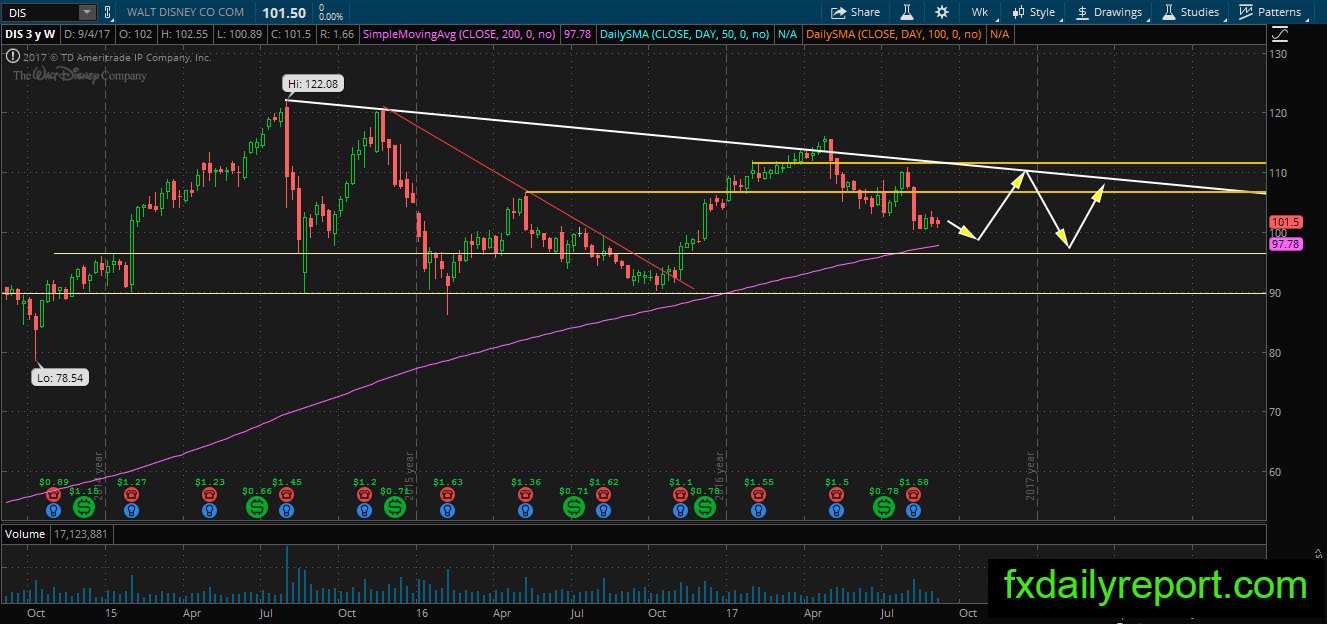
The outlook on the weekly chart also bearish, but it looks like the bearish pressure might stop when the share prices hit weekly SMA 200. The bounce from WSMA 200 might lead DIS trading between the averages and white trendline.
Daily chart

Severe breakdown happens on DIS daily chart after earnings disappointment. Overall, the trend turns bearish as share prices fell below the daily SMA 200. Currently, DIS flirting with $100 handle and looking for a possible bounce. Most notable technical indicator to see is the purple channel, and traders could expect the share prices will respect the channel and move inside it.
Trade plan
The bullish position could be taken $100 handle or lower part of the purple channel when bullish reaction happen. If the price continues its downward movement, $90 is the best level and final level to watch.
The bearish position could be taken if the share price bounces toward daily SMA 200 and form a bearish pattern. Another place to look for a short position is the top of the purple channel.