
USDX (USD Index)
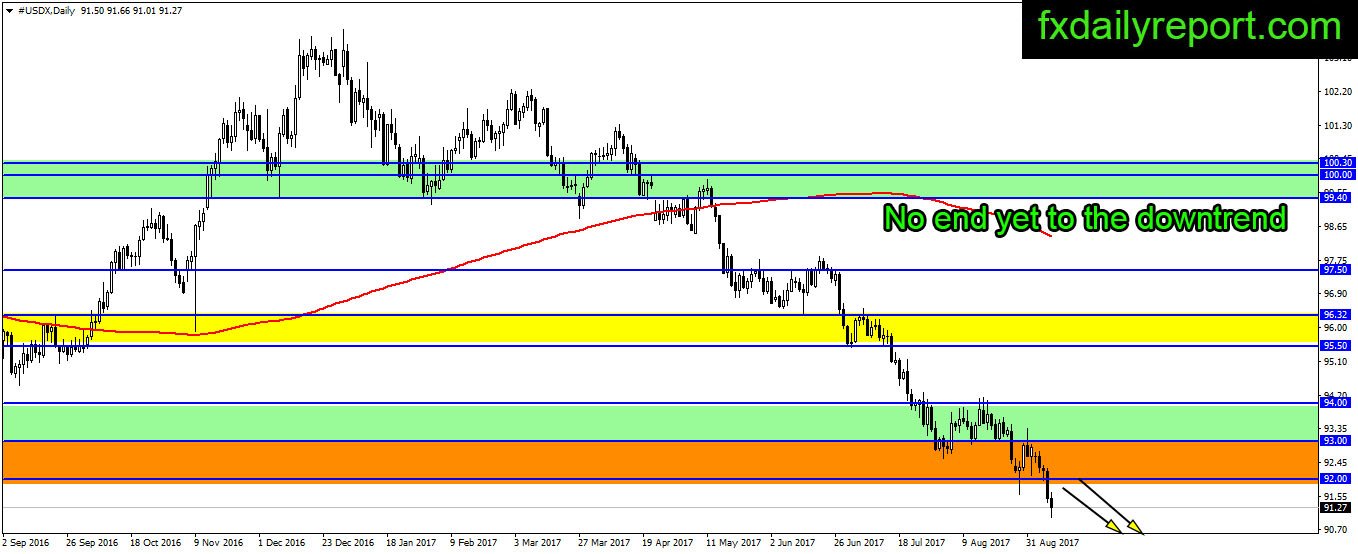

The downward movement of U.S dollar index continues below 92.00 support level and drive the index into a long-term bearish trend. On the monthly chart, we are witnessing the move below 2016 low. Below this level is the 2015 low at 90.53 followed by monthly SMA 200.

Depend on the monthly close, a close below 92.00 warrant more weakness toward the monthly SMA 200. On another side, a close back above 92.00 might lead U.S dollar index higher for a long-term bounce.
News to watch
04.30 AM UK Manufacturing Production, estimated 0.3% increase monthly.
For full outlook for this week, you can follow Forex Outlook For The Week 4 – 8 Sep 2017
Technical Analysis
EUR/USD
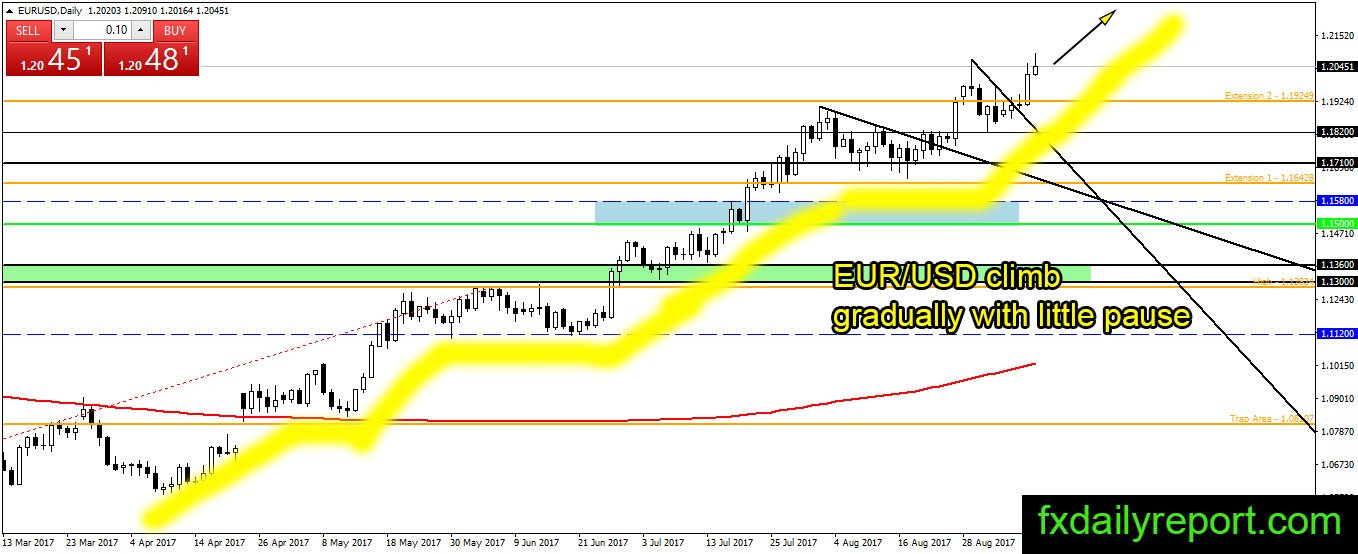
EUR/USD gradual climb on the daily chart brings the pair to new higher high in today trading session. There is no reason to short the pair yet as the bullish trend is strong. This is the last day of the trading week which might lead to a correction in prices.
On the downside, 1.2000 turn into support while 1.2068 is the resistance to break.
Today critical level to watch:
Support: 1.2000, 1.1924, 1.1900, 1.1820
Resistance: 1.2068
GBP/USD
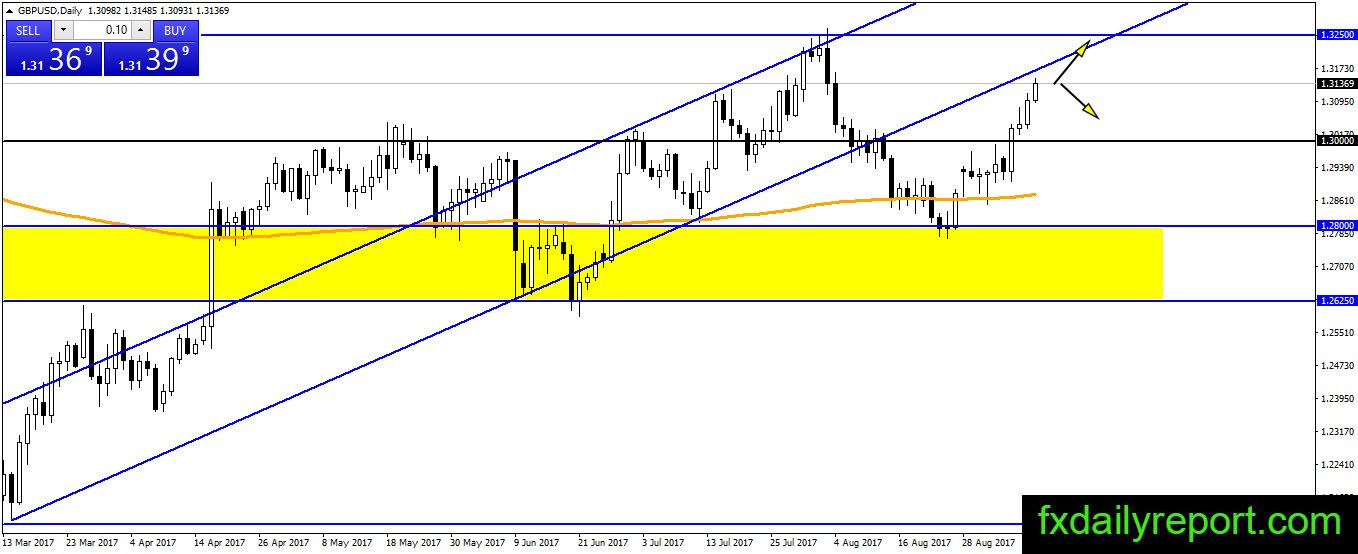
There is not much to hinder GBP/USD upward movement after the bull widening advantage above 1.3000 broken resistance. The pair is currently ready to make another test toward 1.3250. If the bull failed to break and close above 1.3250, it is an initial indication to enter a short position.
Today critical level to watch:
Support: 1.3100, 1.3070, 1.3000, 1.2930
Resistance: 1.3200, 1.3250
USD/JPY
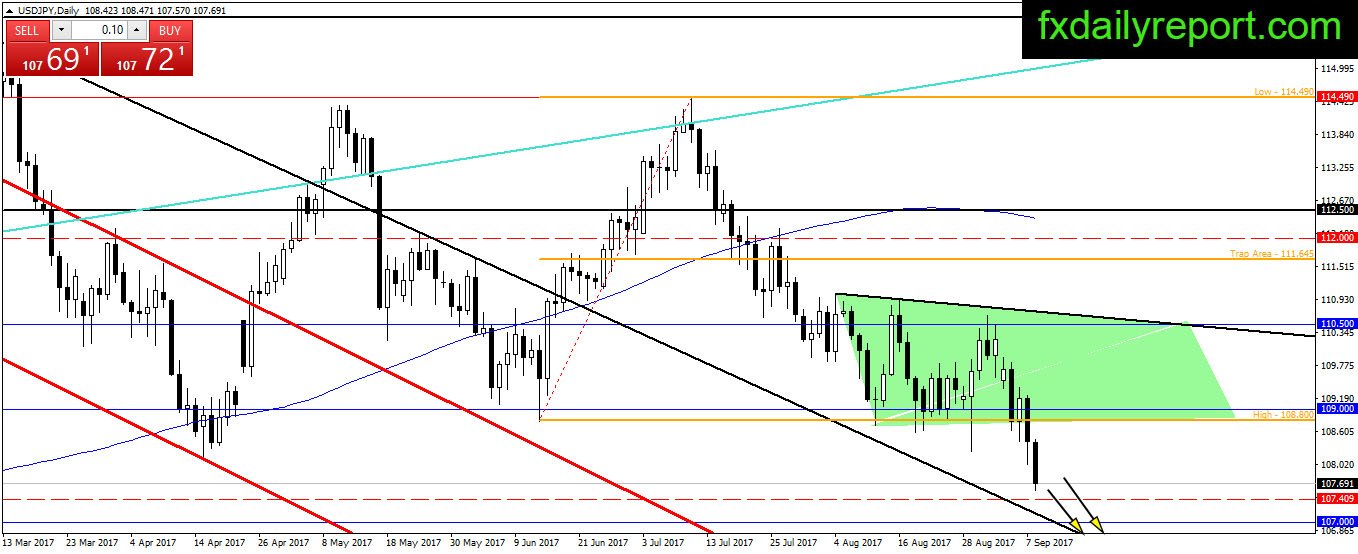
The bull has lost the battle, and it is hard to recover USD/JPY above 109.00 as it continues down to reach 107.40. Currently, the pair expected to trade between 107.40 – 109.00 until breakout happens.
Today critical level to watch:
Support: 107.40, 107.00
Resistance: 108.10, 108.80, 109.00
AUD/USD
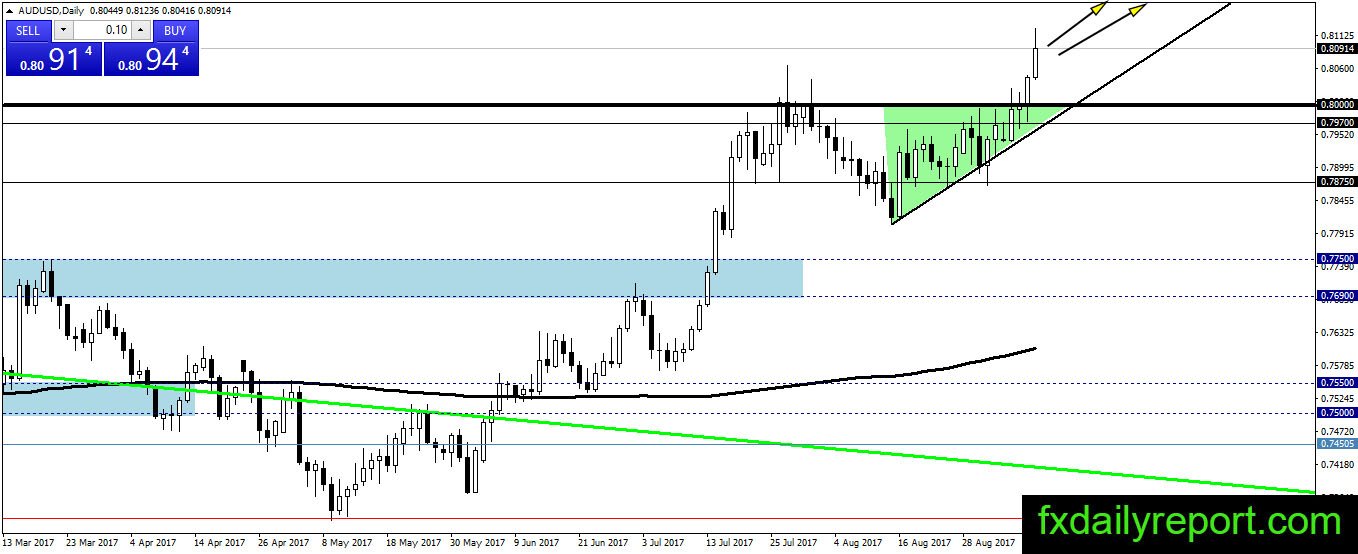
An upside breakout as expected happens in AUD/USD daily chart. The pair has 0.8000 as new normal now, and the trend is bullish as long as 0.8000 maintained. We will update AUD/USD map in coming week following the breakout.
Today critical level to watch:
Support: 0.8000, 0.7970, 0.7900, 0.7875, 0.7834, 0.7750
Resistance: