
EUR/GBP long-term technical analysis
EUR/GBP closed lower on October following sharp sell-off in September. The bearish movement mostly attributed to the growing situation in Catalonia region in Spain. The region declares independence from Spain in October. The action swiftly responded by Spain government by removing the region autonomy and sending officials to seize control.
The bearish sentiment after the news brought EUR/GBP down, but at the start of November, there is major news from BOE which drive Pound Sterling down broadly.

UK BOE announces first interest-rate increase since a decade ago. The reaction is contrary to expected where normally underlying currency strengthen after the news. Pound Sterling tumbled and might continue lower. The direction of EUR/GBP overall bullish after the news and we could expect more upside in coming months.
Click here to read previous EUR/GBP long-term technical analysis
New Month
Monthly chart
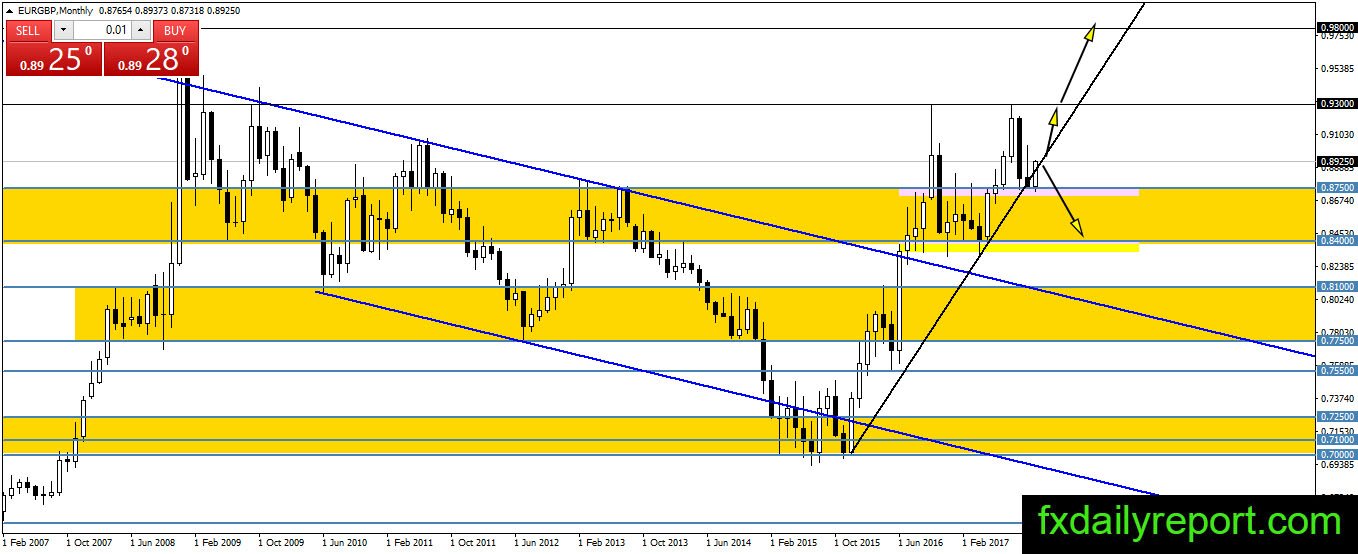
The pair fell to 0.8750 support level in October and maintain a close above the support level. At the start of November, the bull rush in and push the pair higher after the market reacted to BOE interest-rate increase with skepticism. Sell the rumor and buy the news happened on EUR/GBP. Traders could expect EUR/GBP continue higher to test 0.9300.
Weekly chart
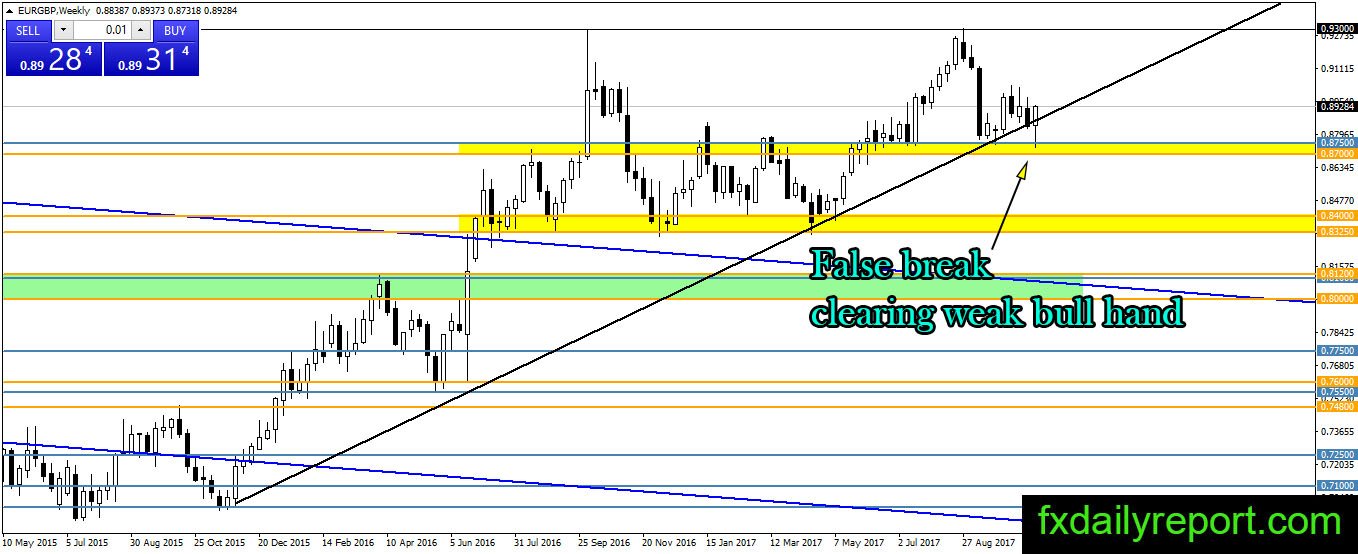
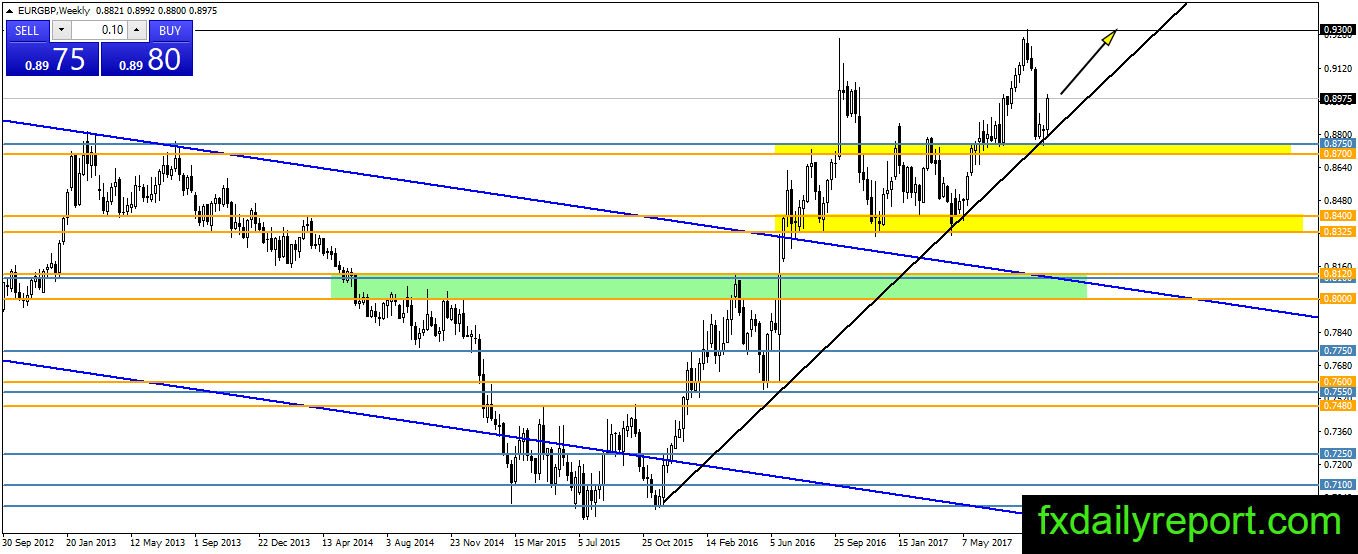
Previous bounce from the black trendline did not hold and could not close higher than the bullish candlestick. On the other hand, EUR/GBP descend below its trendline and make a false break situation. The false break is clearing all weak bull hand and lead the weak bull to re-enter above the trendline. If EUR/GBP could move higher than 0.9031, it might trigger sharp buying toward 0.9300.
Daily chart
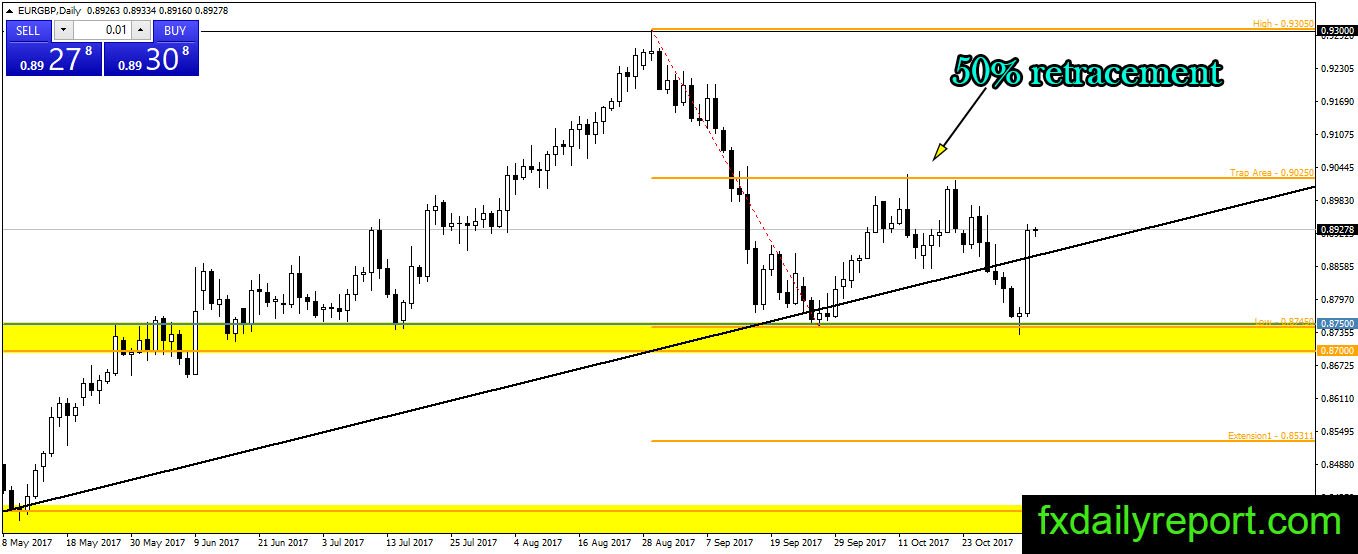
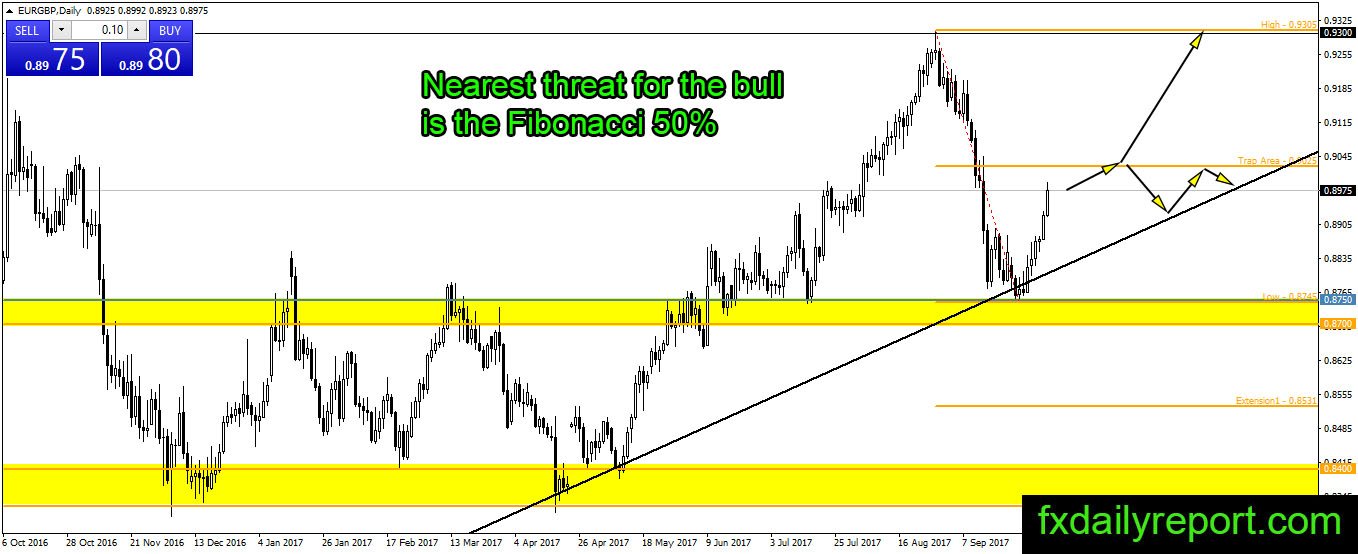
The message on EUR/GBP daily chart is clear where the bear rejected upward movement at the 50% Fibonacci Retracement. Another message comes from the bull where it manages to bring the pair back above the bullish trendline. Traders could expect the pair will continue higher and test 50% retracement again.
Trade plan
A long position could be taken when the pair retraces lower to the black trendline on the daily chart.
A short position could be placed near 50% Fibonacci retracement.