
U.S dollar index long-term technical analysis
The rise of U.S dollar index is an appealing idea since two months ago after the index suffers 11.5% losses from the opening of this year. The index opening level of 102.87 and low of 91.01 suggest 30-50% retracement is due between 94.56 and 96.94. Currently, the index traded at 93.83 and had more room upside.
However, the recovery of U.S dollar index will depend on political stability which influenced by either tax-reform and North Korean issue. Both issues have not resolved yet and will continue to influence the market until the end of the year. This month, U.S dollar index need to either hold out near 95.00 resistance or close above it to prolong the bullish sentiment.
New Month
Monthly chart

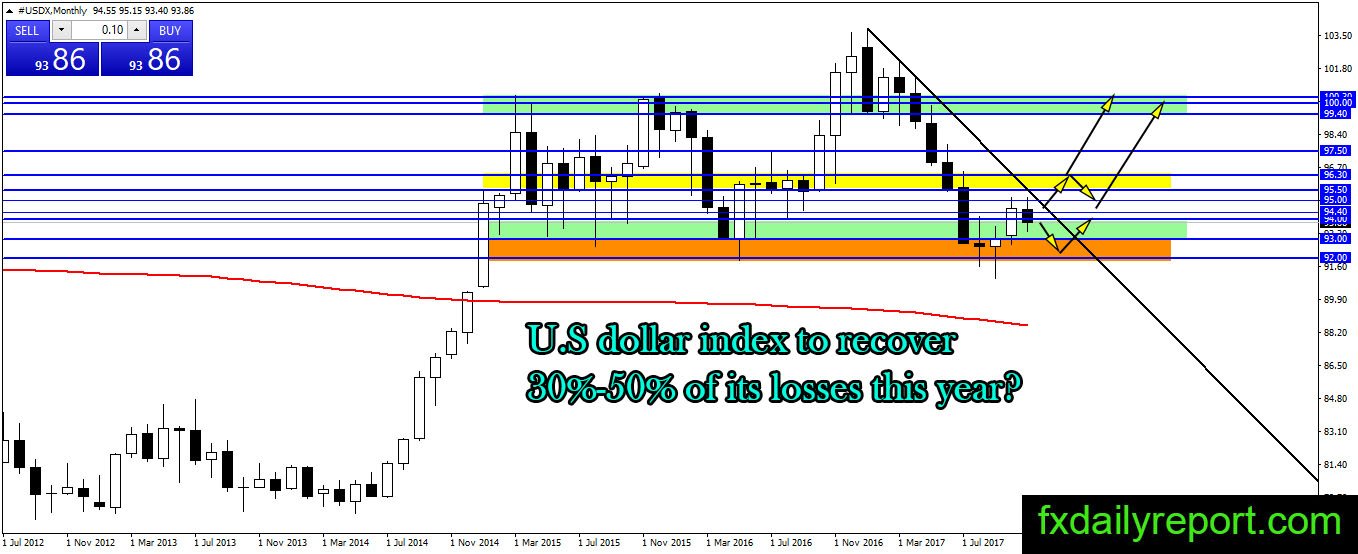
On the monthly chart, the bounce from 92.00 – 93.00 is accounted, and the index reached 95.00 in the second month. On November, the outlook switches to bearish again, but it looks like the selling pressure is contained near 93.00. If the index could close above 94.00 it
Weekly chart
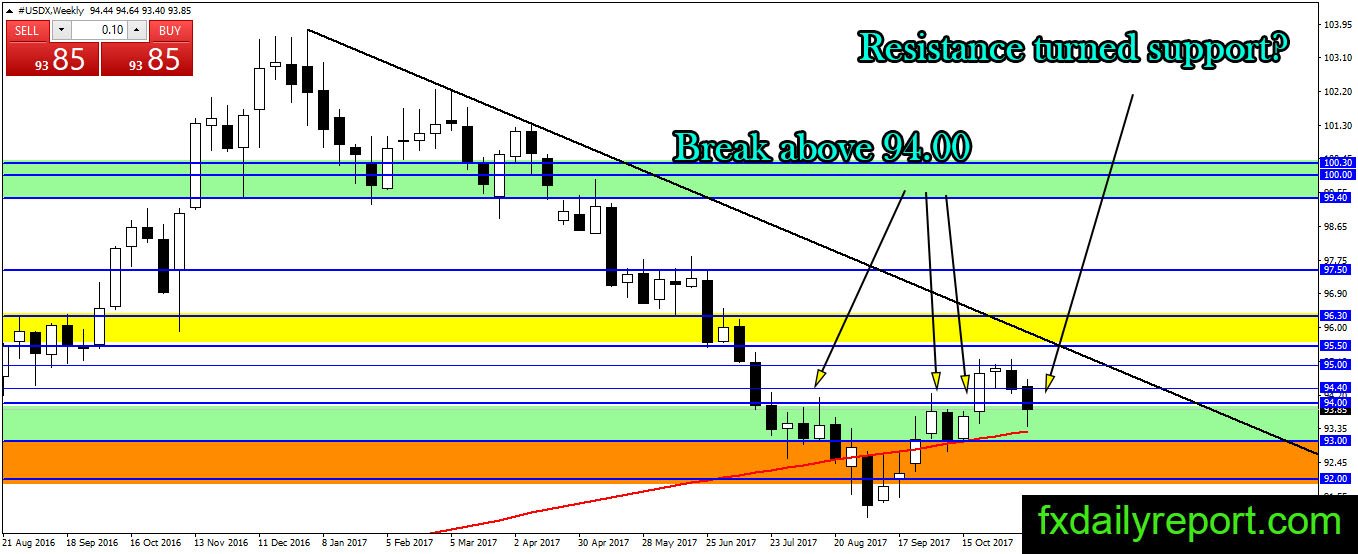
The bull is in control of U.S dollar index weekly chart after the break above 94.00. Currently, the index is testing the broken resistance. Will the resistance act as support this time? Traders will observe the weekly close of the index. A close above 94.00 is bullish and will ensure the bullish continuation.
Daily chart
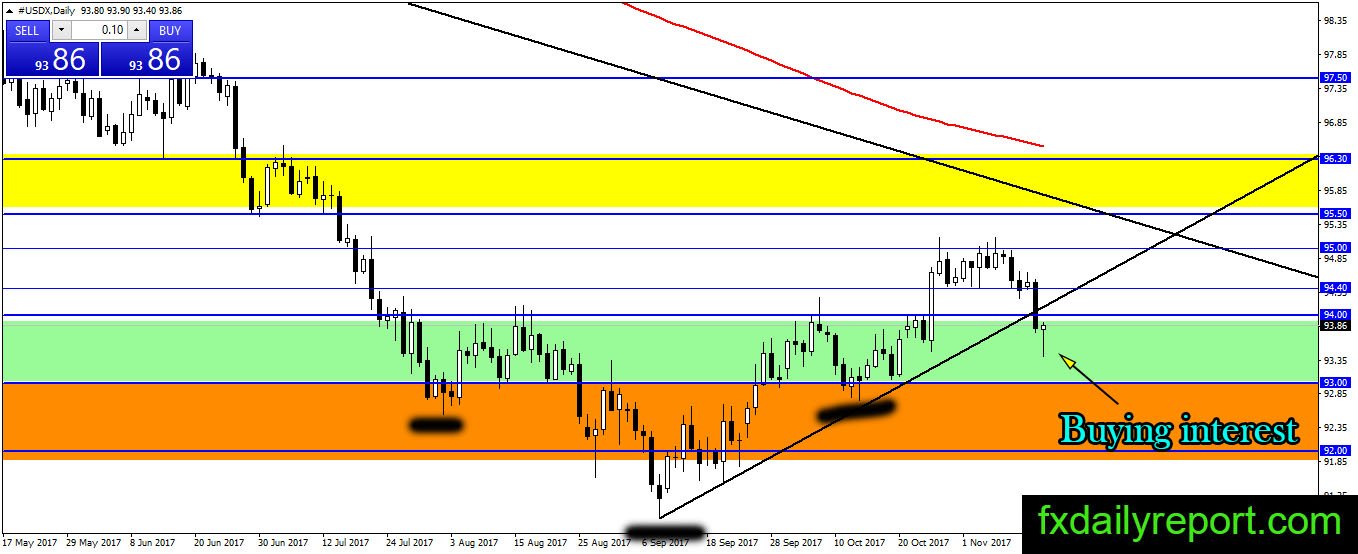
Inverted shoulder-head-shoulder pattern confirmed on the daily chart and U.S dollar index blast through its 94.00 resistance. The index currently moves lower to test the broken neckline. First-day test results in a close below the neckline. If the index could bounce and close above broken neckline in 1-3 days, it is a “Save” and confirmation for bullish continuation.
Trade plan (For U.S dollar pair)
A long position near 94.00 and the black trend line is the setup which trader need to watch.
Short position less likely to succeed, but it could be taken when the index near 94.00 and could not close above it.