
EUR/GBP long-term technical analysis
Not much think happened since February analysis. EUR/GBP movement continue limited between 0.8750 – 0.9000 area. Favorable EUR news comes from ECB as the central bank maintains hawkish outlook on the rate and the economy. Meanwhile, there is not much development from UK side.
The global market situation currently deeply influenced by U.S President Trump Tariff plan. The President is pushing higher tariff on imported Aluminium and steel. European Union has not decided on reaction, but Trump threatens further tariff adjustment if the Union reacted negatively to the tariff decision.

Click here to read previous EUR/GBP long-term technical analysis
New Month
Monthly chart
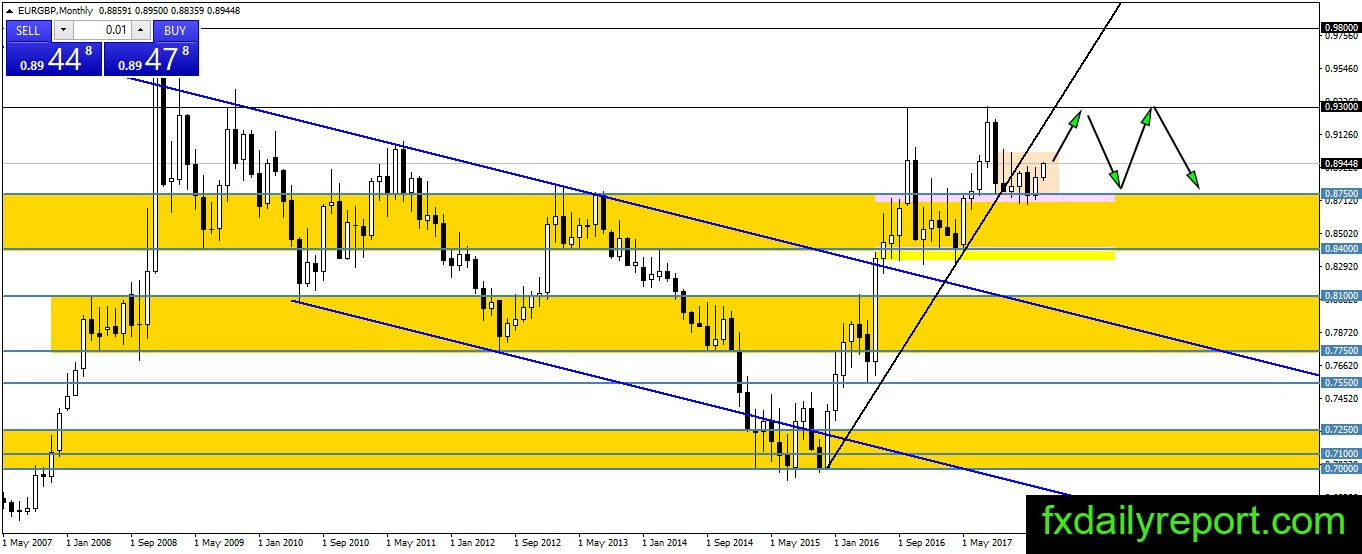
The bull is in advantageous situation after the bounce from 0.8750 support level. EUR/GBP currently launched from the support and might move higher toward 0.9300. The nearest resistance to watch is 0.9000 where the bull needs to close above it before the bullish trend could continue.
Meanwhile, a move below 0.8750 is not favorable for the bull and could drive EUR/GBP into a long-term correction.
Weekly chart
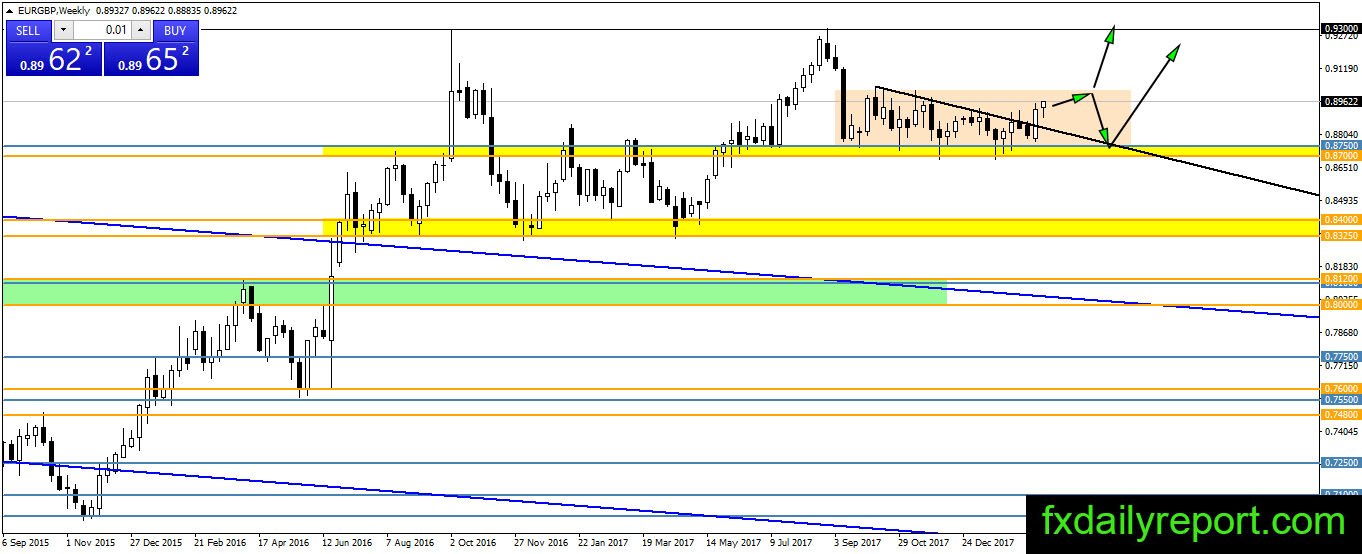
EUR/GBP broke above the trendline shown on the weekly chart and headed to the top of the bisque box where 0.9000 resistance present. The key for next movement is how the price reacted at the top of the box. If the bull could break higher, then we will see the pair sharp movement toward 0.9300.
Daily chart
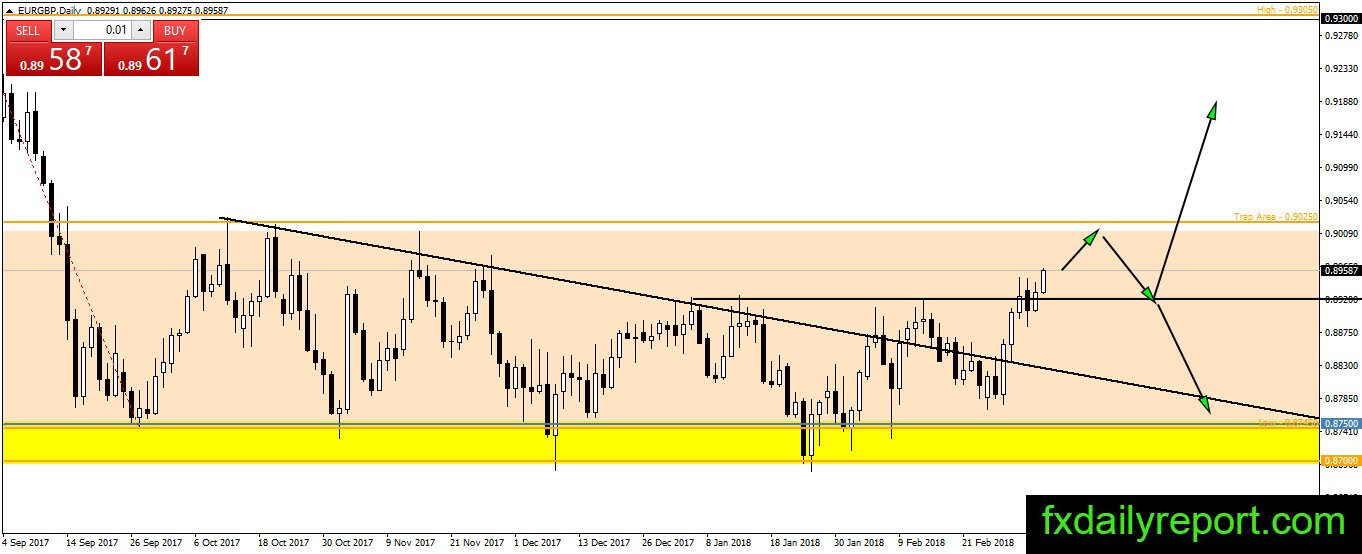
The situation on the daily chart shows a breakout above horizontal resistance at 0.8920. The break happens after three days stall which is a valid break. If there is no change to the current trend, then EUR/GBP expected to test 0.9000 resistance days or weeks later.
Trade plan
Traders suggested trading the bisque color box range until breakout happens. Long position around 0.8750 – 0.8800 and short position around 0.8980 – 0.9020 might be the best scenario to consider. (Same scenario as Feb’18).