
USDX (USD Index)
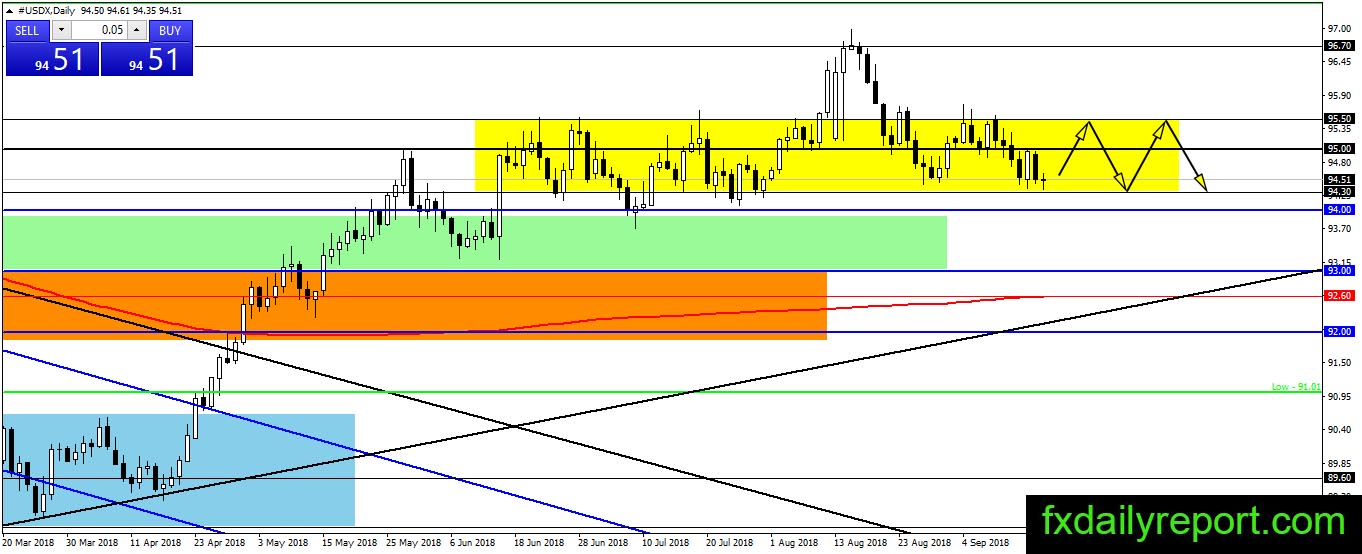
Weakness resume in U.S dollar index on Monday trading session. The index settled lower and back near 94.30 support level. Today, the bear managed to push the index down again near 94.30. Fortunately, the bull returns and bring the index to its opening level.

We think the index will continue its ranging inside the yellow box this week and bounce might happen soon. However, there is news from the UK and the Eurozone which could move the market this week. Traders might want to prepare when the news released.
News to watch
For full outlook for this week, you can follow Forex Outlook For The Week 17 – 21 September 2018
Technical Analysis
EUR/USD
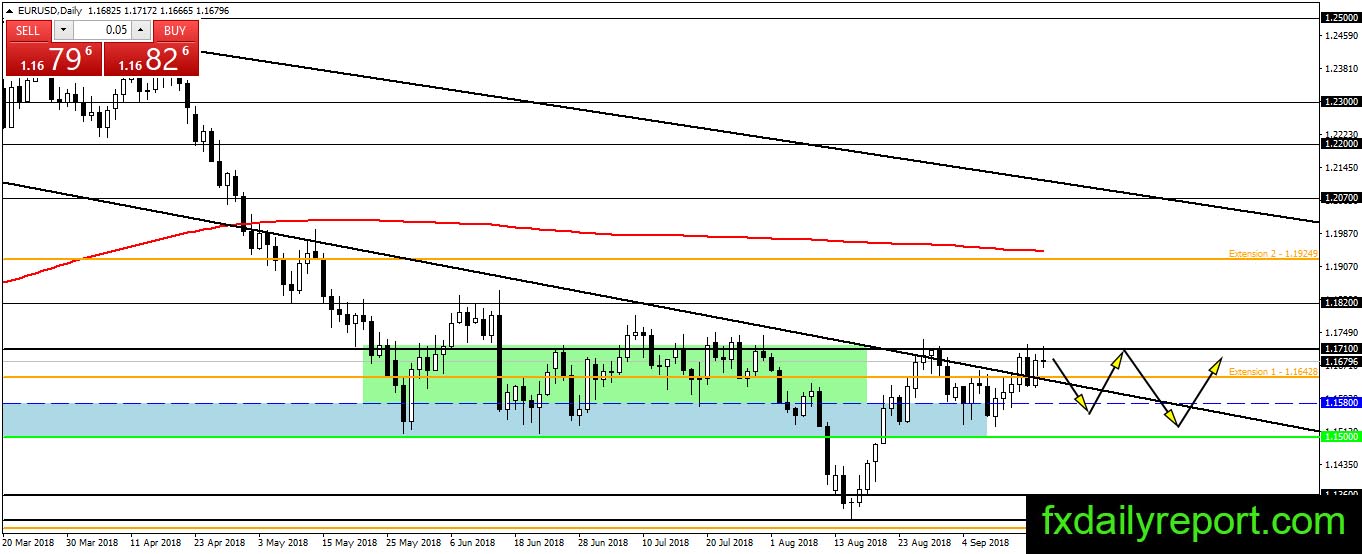
EUR/USD make another attempt on 1.1710 resistance today and there is mini rejection. No conclusion yet on the next direction, however, we think EUR/USD will take downward turn and test 1.1500 – 1.1580 support area again. Traders could look for short position near the current level with a stop above 1.1710.
Today critical level to watch:
Support: 1.1650, 1.1600, 1.1580, 1.1500
Resistance: 1.1710
GBP/USD
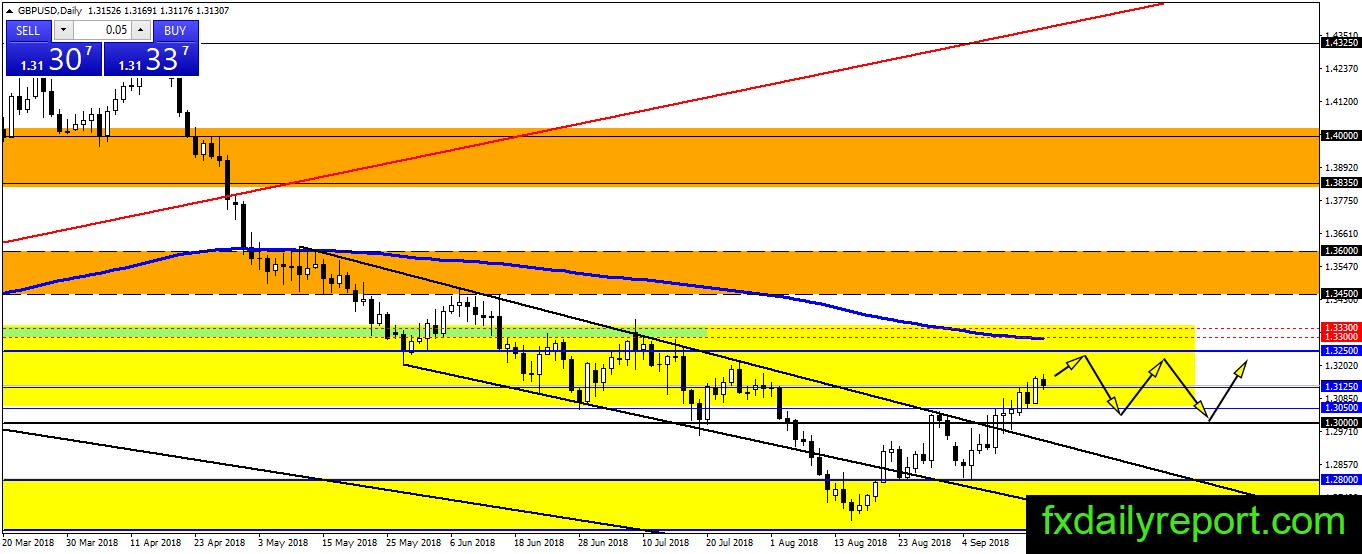
GBP/USD print another bullish candlestick and closed above 1.3125 which bring the pair nearer to 1.3250 – 1.3300 target area. There is no change to the pair projection and traders could continue holding a long position. But, when the pair reaches SMA 200 or 1.3250 – 1.3300 and the bearish pattern formed, traders might want to switch to a bearish bias.
Today critical level to watch:
Support: 1.3125, 1.3100, 1.3000, 1.2800
Resistance: 1.3250, 1.3300
USD/JPY
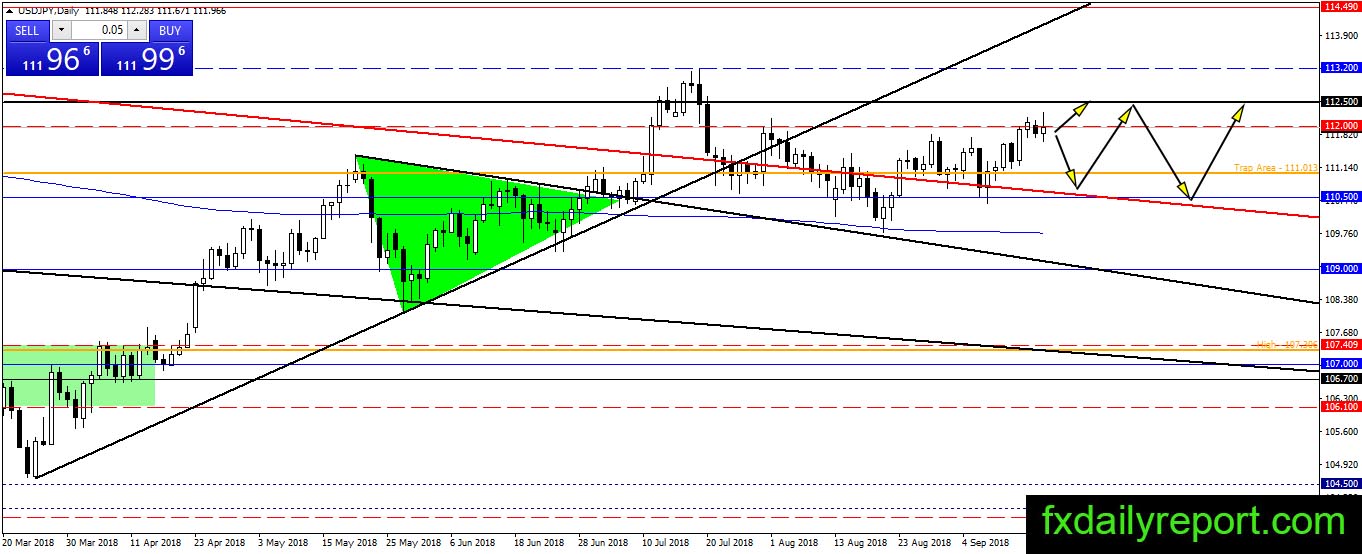
USD/JPY seems to get impatient at 112.00 resistance as the pair attempt to jump toward 112.50. The upward thrust intercepted by the bear and the pair back near its opening level today. There is no clue yet on next direction, however strong bearish pattern at the end of the day will lead USD/JPY down to test 111.00 or red trendline again.
Today critical level to watch:
Support: 111.00, 110.50, 110.00
Resistance: 112.00, 112.50
AUD/USD
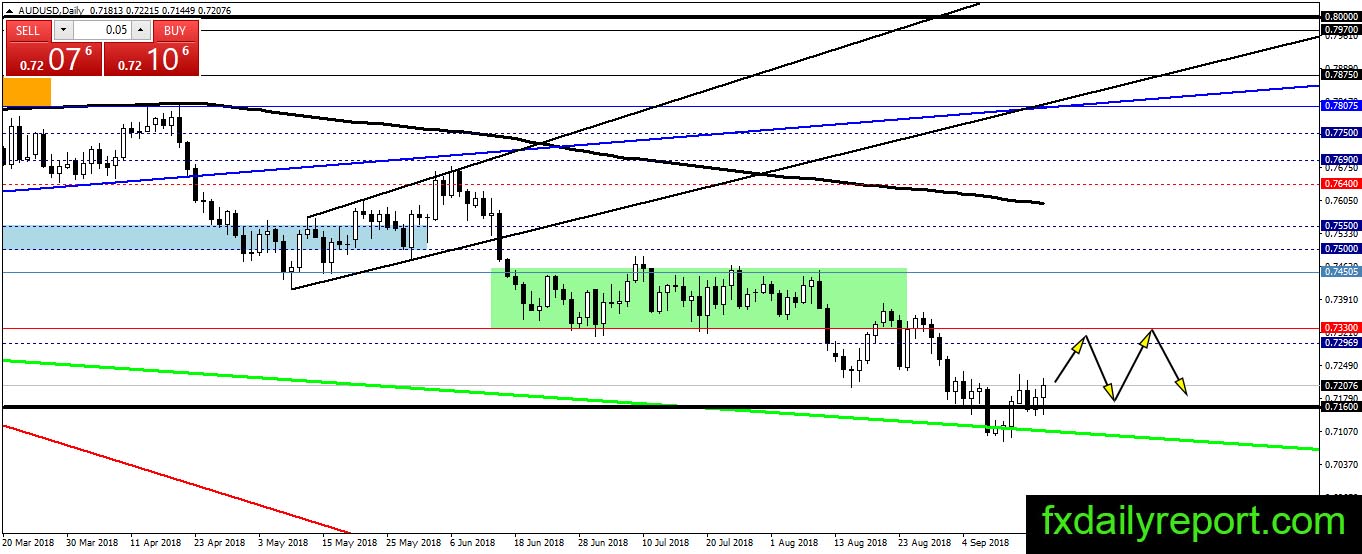
A bullish indication is shown again at 0.7160 on AUD/USD daily chart. If the pair follows our projection upward, then we might see AUD/USD hanging near 0.7300 – 0.7330 soon. Traders could continue to use 0.7160 as support level to place long position. A stop order below 0.7160 also suggested anticipating a sudden continuation of the bearish trend.
Today critical level to watch:
Support: 0.7160, 0.7100, 0.7000
Resistance: 0.7300, 0.7330