
The price of Bitcoin (BTC/USD) has been on a volatile path over the last three weeks. The world’s most popular cryptocurrency has fallen below $3,500 and breached the $4200 level in a space of three weeks, which illustrates how volatile it has been given its significantly low price compared to the average for the last two years.
BTC/USD Fundamental Analysis
The price of bitcoin relies upon the market sentiment towards cryptocurrencies. If the sentiment is negative as it has largely been over the last 12 months, then the chances are bitcoin price will continue to fall.

Currently, traders are looking at the news that more mainstream businesses are continuing to embrace cryptocurrencies. For instance, Square Cash App reportedly netted $165 million in sales last year driven by its bitcoin wallet.
Top crypto market traders have also cited the possibility of giant online retailers and advertisers like Google, Facebook, and Amazon as the potential catalysts for the next bullish run in the cryptocurrency market.
BTC/USD Technical Analysis (the 240-min Chart)

The price of BTC/USD has been trading within a widening bullish wedge over the last three weeks, but recently seems to have started to consolidate towards the support baseline. BTC/USD crossed below the 50-period moving average when it made that massive plunge at the start of the week dropping from above the $4,200 level to trade at just above the $3,800 level.
Since then, the movement has been rather sideways, which suggests that the baseline support is holding strong for now. The bulls will target profits at around $3,970 should a rebound occur while the bears will be aiming for a move down towards the $3,830 level.
BTC/USD Technical Analysis (the Daily Chart)
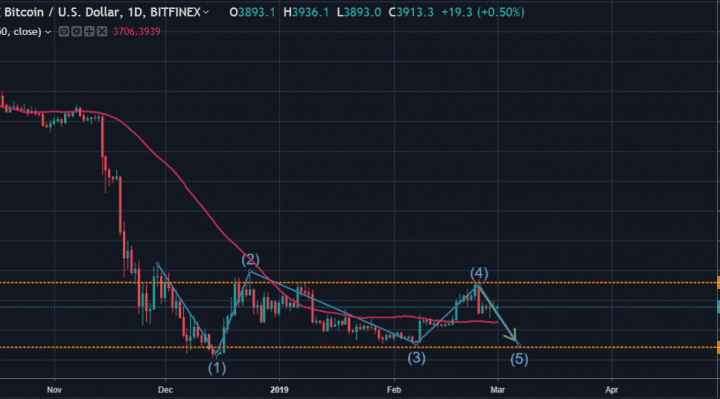
In the daily chart, the price of Bitcoin appears to be under major downward pressure, illustrated Elliot’s 5-step impulse wave analysis. The BTC/USD recently completed the fourth wave and now looks set to lock in the fifth wave, which based on the current positioning would suggest a bearish movement. That move could take BTC/USD to a new yearly low below the $3,400 level.
In summary, the bears will be more optimistic going into the new month, but the bulls will also hope that the 50-day moving average could repel the BTC/USD from falling further down.