
The US Dollar Index (DXY) pulled back on Tuesday to trade below the key level 98.50 as it continues to oscillate in a consolidative pattern formation. The USDX has been trading in a converging wedge over the last three weeks and the latest pullback takes it closer to a pending breakout.
The US Dollar Index is currently pegged just below the 100-hour and the 200-hour moving average lines and this indicates a short-term bearish pressure in the market sentiment.
The US Dollar Index Fundamentals Overview

From a fundamental perspective, the US Dollar Index is trading at the back of a string of economic events including the latest release of the Housing Price Index for July, which beat expectations of 0.3% change with 0.4% (MoM).
Yesterday, the Preliminary Markit Manufacturing PMI and Markit PMI Composite for September beat expectations of 50.3 and 49.6 with 51.0 and 51.0 points respectively. On the other hand, the Services PMI missed expectations of 51.5 with 50.9 points.
The 3-month and 60-mon bill action rates edged lower for the week to 1.905% and 1.86% down from 1.945% and 1.87% respectively. However, the 2-year action rate climbed to 1.612% up from 1.516%.
The impasse between the US-China trade talks continues to weigh on the US Dollar Index and this could push the USDX lower towards 98.00.
The US Dollar Index Technical Analysis (the 60-min Chart)
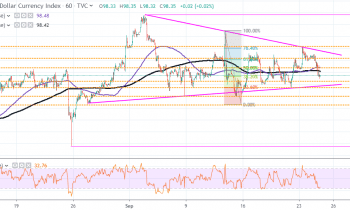
Technically, the US Dollar Index appears to have recently hit the boundary to the oversold levels of the relative Strength Index indicator. This could trigger a short-term rebound which creates interesting opportunities for the bulls.
Therefore, the bulls will be targeting profits at around 98.48, 98.84 or higher at the current 28-month high of 99.37. On the other hand, the bears will look to target short-term profits at around 98.25, 98.15, 98.00 or lower at 97.85.
The US Dollar Index Technical Analysis (the Daily Chart)
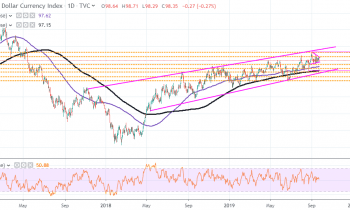
In the daily chart, the USDX continues to trade in a slightly ascending channel, which indicates that it is experiencing a long-term bullish bias in the market sentiment. It is currently pegged several pips above the current 100-day and 200-day moving average lines and this supports the case of bullish pressure.
The bulls will be targeting long-term profits at around 99.37 or high at 100.00 while the bears will be looking to pounce at around 97.15 or lower at 96.42.
In summary, the US Dollar Index appears to be experiencing a short-term bearish pressure but in the long-term, the bulls retain control.