
USDX (USD Index)
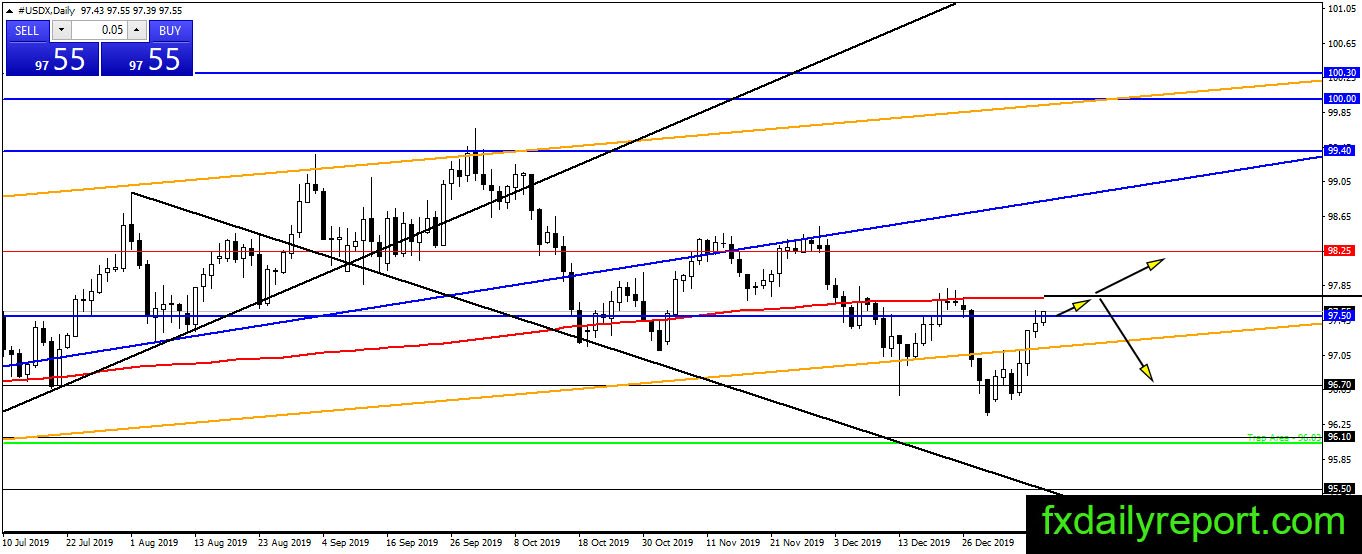
Further bullish pressure happens in the U.S dollar index chart. The index currently testing 97.50 resistance and will target daily SMA 200. Traders will monitor the index reaction today and watch where the index close. Today job data might provide volatility in the market and the index could either rejected or breakout from 97.50.
News to watch

08.30 AM U.S Non-Farm Employment Change, forecast 162k
Unemployment Rate, forecast 3.5%
For full outlook for this week, you can follow Forex Outlook For The Week 6 – 10 January 2020
EUR/USD
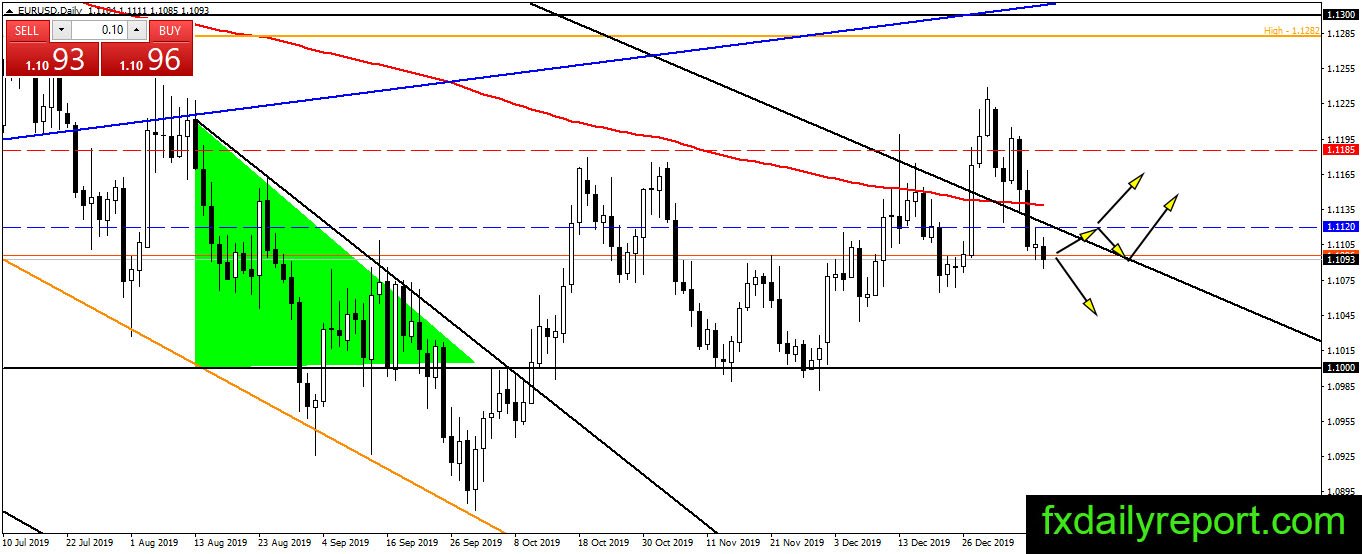
EUR/USD fell below 1.1120 and made another close below it yesterday. At the current time, the pair has broken below the previous day low and it is at the risk of further weakness. Traders will observe the pair reaction after today’s U.S job data. A close above 1.1120 will trigger bullish sentiment next week.
today critical levels to watch:
Support: 1.1000, 1.0900
Resistance: 1.1120, 1.1185
GBP/USD
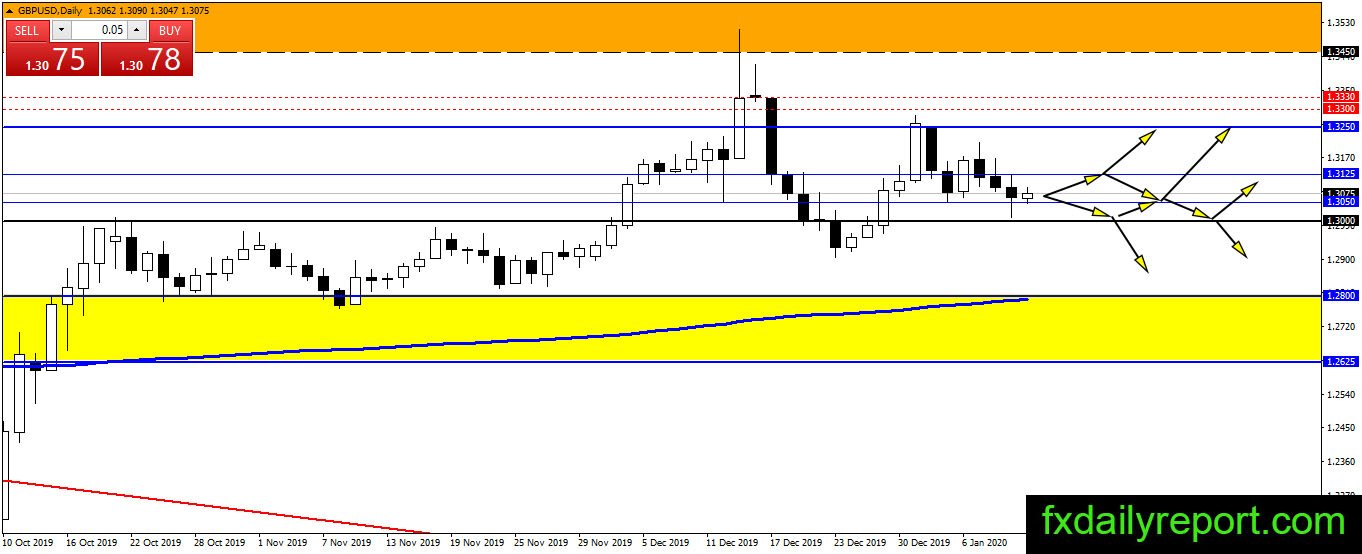
The area between 1.3000 – 1.3050 is the buy area. The pair attempted to move lower yesterday but we have a bullish reaction. If the pair could continue to maintain its position above 1.3000 by the end of the week then GBP/USD expected to bounce toward 1.3250.
Today Critical level to watch:
Support: 1.3050, 1.3000, 1.2800, 1.2625
Resistance: 1.3125, 1.3250
USD/JPY
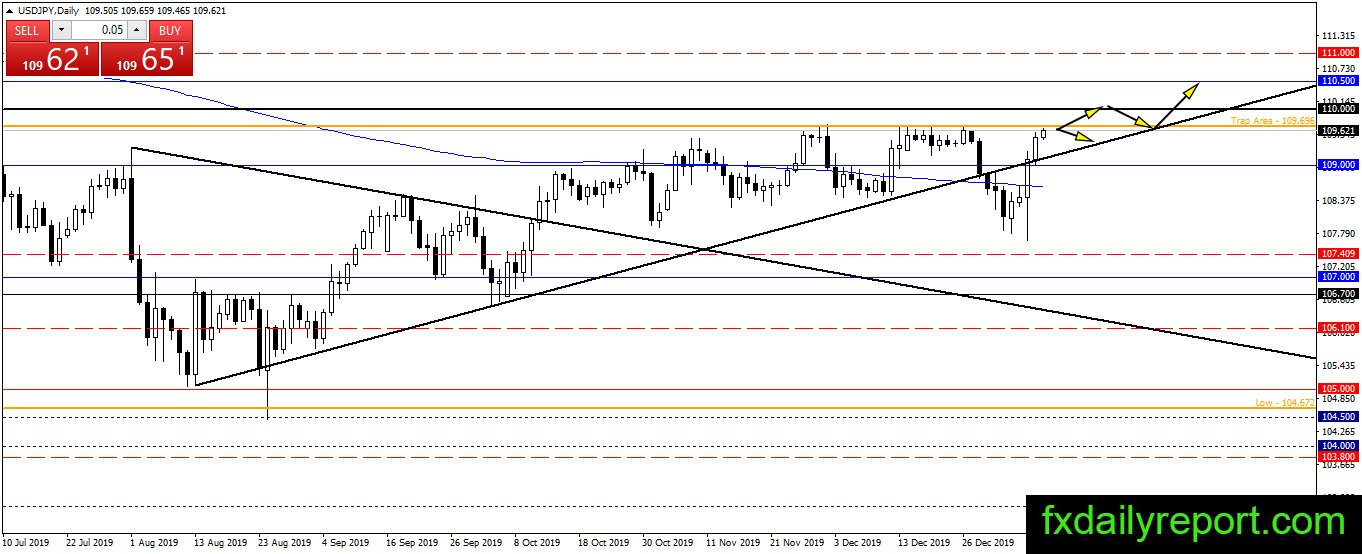
No stop to the bullish pressure in USD/JPY yet. The pair almost reach 109.70 resistance today and it might continue upward to test 110.00 later. Similar to the previous event, traders might want to wait for a reaction from the market yet near 109.70 – 110.00. We think the pair might breakout this time after fake breakout below SMA 200.
Today critical levels to watch:
Support: 109.00, 107.40, 107.00
Resistance: 109.70, 110.00
AUD/USD
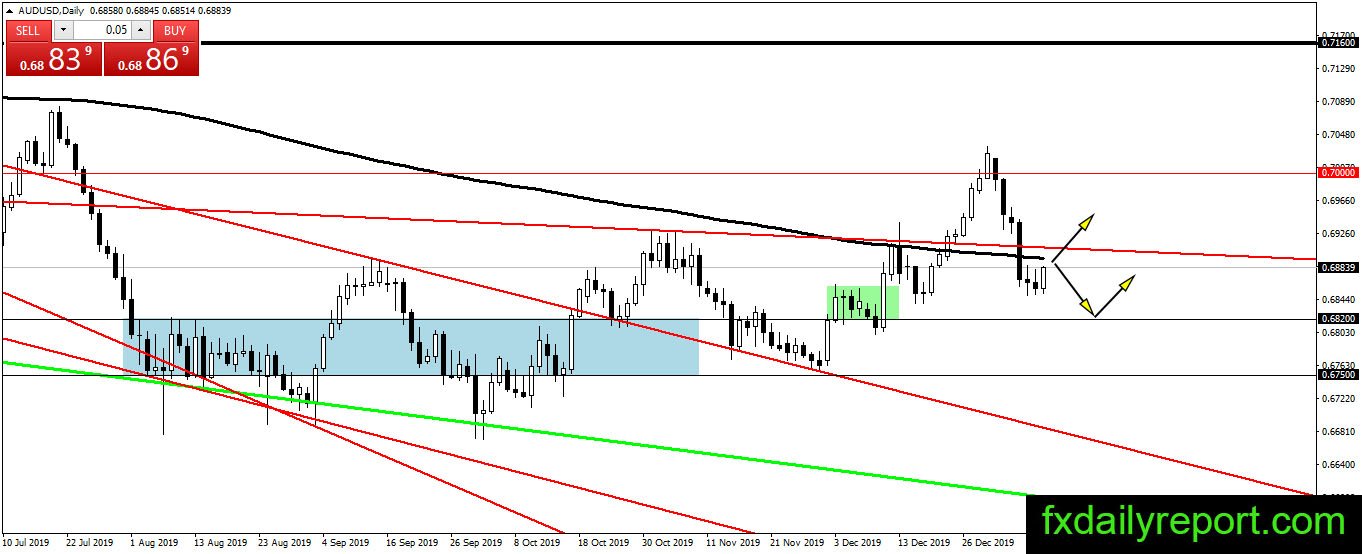
It is a critical day for AUD/USD. The next trend of the pair will be determined by where the pair closed by the end of the day. A close below SMA 200 is a bearish confirmation and AUD/USD might continue lower toward 0.6820. On the other side, a close above SMA 200 might be a long-term bullish confirmation.
Today critical levels to watch:
Support: 0.6820, 0.6800
Resistance: 0.6900, 0.7000