
The USD/CAD currency pair on Wednesday pulled off the 1.3070 level to trade at around 1.3040 after the US CPI missed expectations. The currency pair has been trading in a sideways movement for the best part of this week. The resistance level just above the 1.3070 appears to be holding firm while the 200-hour SMA is providing support.
The pair is currently pegged between the 100-hour SAM and the 200-hour SMA, which indicates that the consolidative sideways movement could continue through Friday.
USD/CAD Fundamentals Overview

From a fundamental perspective, the USD/CAD currency pair is trading at the back of a relatively busy period in both the US and the Canadian markets. On Tuesday, the US NFIB business optimism index missed the ex[ectation of 103.1 with 102.7. On the other hand, the Consumer Price Index ex-food and energy for December missed the (MoM) expectation of 0.2% with 0.1% while the (YoY) figure was in line with expectations at 2.3%.
Both the seasonally adjusted and non-seasonally adjusted CPIs also came short of expectations. And on Wednesday, the Producer Price Index followed the same trajectory missing the (MoM) and (YoY) ex-food and energy forecast for December. The general PPI also missed the (MoM) expectation of 0.2% with 0.1% while the (YoY) CPI was in line at 1.3%.
In Canada, the latest business outlook survey released by the bank of Canada on Monday showed an increased optimism in the market, which further continued to boost the CAD.
USD/CAD Technical Analysis (the 60-min Chart)
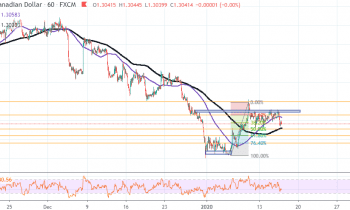
Technically, the USD/CAD currency pair appears to be experiencing significant pressure both from the bulls and the bears. This is canceling out the momentum either side of the market. As such, the pair continues to trade in a consolidative sideways movement in the short-term.
Therefore, the bulls will be targeting short-term profits at around the 23.60% Fib level at 1.3065 or higher at 1.3100. On the other hand, the bears will look to pounce at around 50%, 61.80% and 76.40% Fib levels at 1.3030, 1.3010 or lower at 1.2990.
USD/CAD Technical Analysis (the Daily Chart)
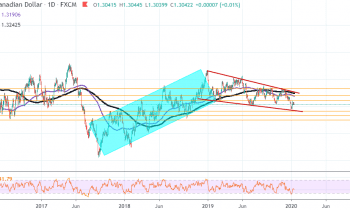
In the daily chart, the USD/CAD currency pair appears to be trading within a relatively descending channel, which indicates significant bearish pressure in the long-term market sentiment. The pair has recently bounced off oversold levels of the RSI indicator in the daily chart. This shows that the bulls are attempting a reversal.
Therefore, the bulls will be targeting long-term profits at around 1.3107, 1.3202 or higher at 1.3335. On the other hand, the bears will target profits ta around 1.2917, 1.2825 or lower at 1.2750.