
The AUD/USD currency pair on Thursday pulled back off session highs of about 0.7013 to trade at around 0.6972 after the announcement of the Australian employment data. The currency pair continues to trade within an ascending wedge in the 60-min chart.
It is now pinned around the current level of the 100-hour and the 200-hour SMA lines. Today’s pullback also pushed the currency pair closer to oversold levels of the 14-hour RSI.
AUD/USD Fundamentals Overview

The AUD/USD currency pair is trading at the back of a relatively busy period in both markets. On Thursday, Australia’s HIA new home sales for May edged higher 87.2% up from the previous period’s reading of -4.2%. However, consumer inflation expectations for July missed 3.8% with 3.2%. Part-time employment for June improved to 249k up from -162.3k in the previous period while full-time employment came in at -28.1k versus -101.9k previously. The seasonally-adjusted employment change for June beat 112.5k with 210.8k. The participation rate of 64% was slightly better than 63.6% expected while the unemployment rate was in line at 7.4% up from 7.1%.
In the US, the initial jobless claims for the week ending July 10 missed the expectation of 1.25M with 1.3M. On the other hand, continuing claims beat 17.6M with 17.338M. The retail sales control group posted a change of 5.6% for June down from 10.1% in the previous month. The market was expecting a change of 3.6%. General retails sales outperformed the (MoM) expectation of 5% with 7.5%. Retails sales ex-autos also beat with 7.3% versus 5%.
AUD/USD Technical Analysis (the 60-min Chart)
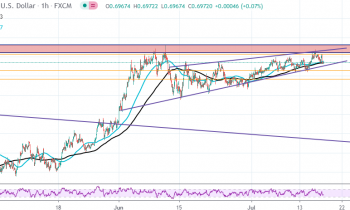
The AUD/USD currency pair appears to be trading within an ascending wedge in the 60-min chart. This indicates a short-term bullish bias in the market sentiment. However, on Thursday the pair pulled back to find support off the 100-hour and the 200-hour SMA lines.
The bulls will be targeting short-term profits at around 0.7013 or higher at 0.7063 going into the tail-end of the week. On the other hand, the bears will look to pounce for pullback profits at around 0.6927 or lower at 0.6883.
AUD/USD Technical Analysis (the Daily Chart)
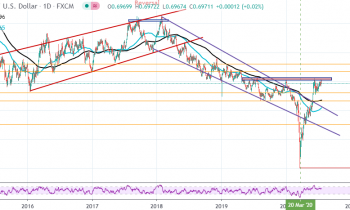
In the daily chart, the AUD/USD currency pair appears to java made a full recovery after a massive plunge at the start of the year. However, the pair has also found strong resistance at current 15-month highs of about 0.7050. It is now closer to overbought levels of the 14-day RSI.
The bulls will target long-term profits at around 0.7168 or higher at 0.7304. On the other hand, the bears will look to pounce at around 0.6803 or lower at 0.6665.