
Gold waiting for a break
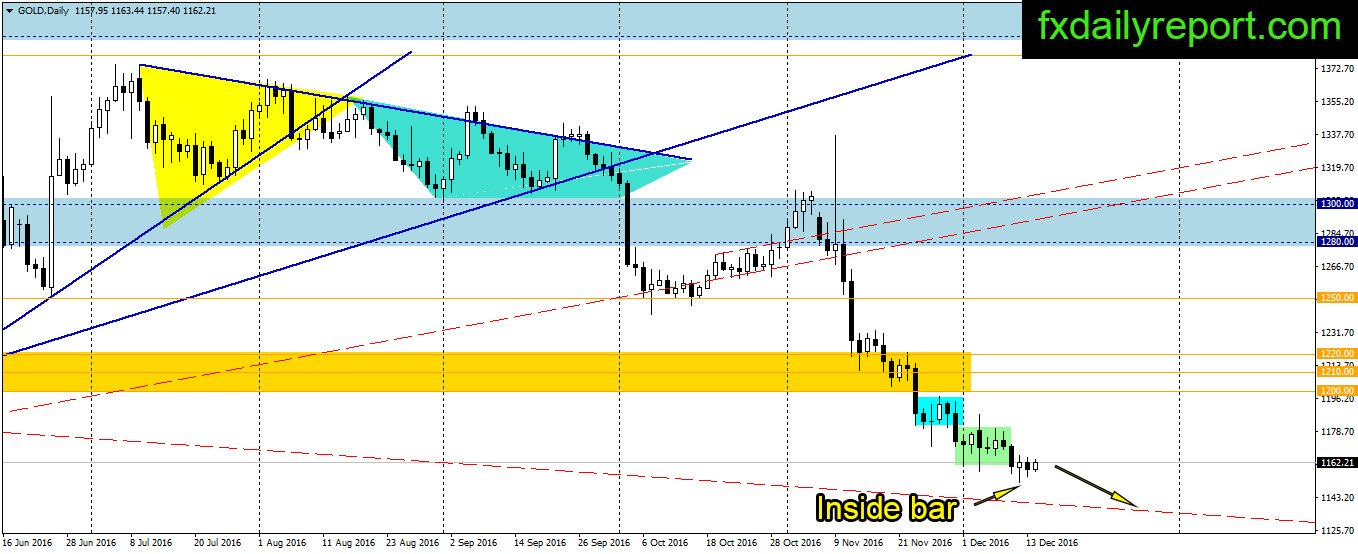
Inside bar formed on the daily chart of gold, the formation is neutral and next direction will be determined after a break either higher or lower than the candlestick. On the downside, the gold price expected to reach its broken channel, while on the upside $1,200 – $1,220 will become its heavy resistance.
Today critical level to watch:

Support: $1,150, $1,138
Resistance: $1,160, $1,166, $1,170, $1,177
Silver overall bearish
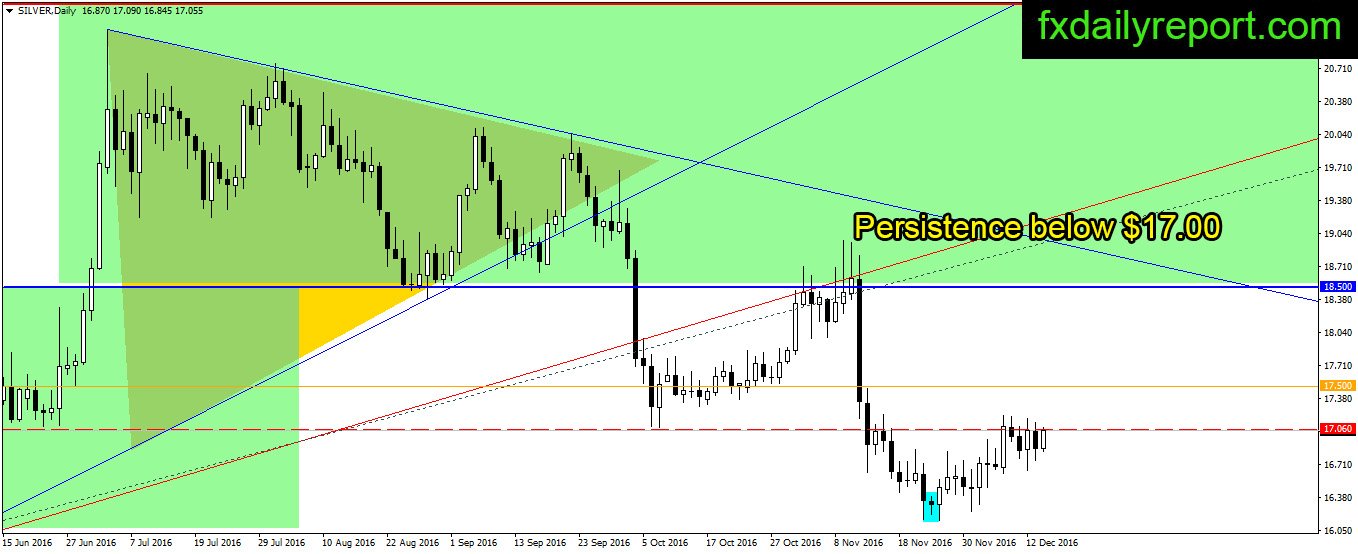
The price of silver continues its sideway movement below $17 resistance. The price also formed inside bar pattern which is a neutral candlestick. However, because of the location of the candlestick and latest lower close, we can say it is a bearish pattern and might break lower after today The Fed interest rate announcement.
Today critical level to watch:
Support: $16.90, $16.75, $16.50, $16.40, $16.00, $15.80
Resistance: $17.00, $17.20, $17.50
Crude Oil higher but under pressure
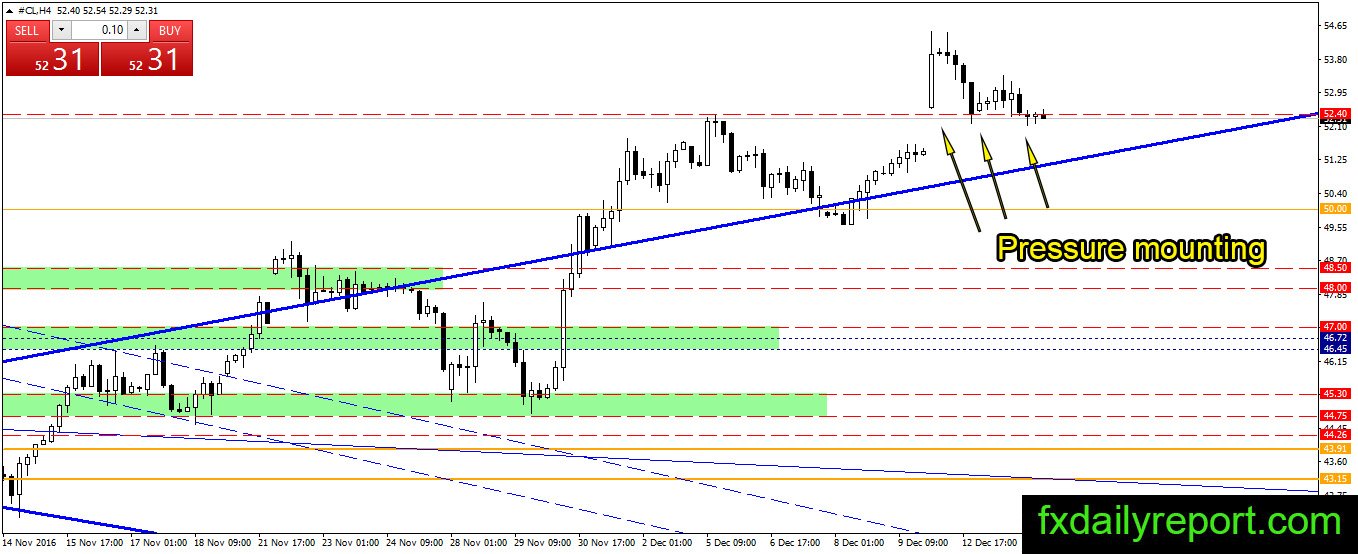
Crude oil price slides lower after recent rally above $52.40. The level protected from downside pressure but looking at the price it might not hold longer. There is a possibility the price will move toward the blue trend line before entering another bullish leg.
Today critical level to watch:
Support: $52.40, $51.93, $50.70, $50.00
Resistance: $54.50, $55.00