
The EUR/CHF currency pair on Friday pulled back off the current 3-week highs of about 1.1119 to trade at around 1.1079 following the latest round of EU data. The currency pair appears to be trading within a slightly ascending channel formation after last week’s reversal.
The pair remains a few levels above the 100-hour SMA while the 200-hour SMA is more levels below. The latest pullback pushed the currency pair back to the normal trading zone for the 14-hour RSI.
EUR/CHF Fundamentals Overview

From a fundamental perspective, the EUR/CHF currency pair is trading at the back of a relatively busy period in the EU market. On Thursday, the EU Markit Manufacturing PMI for March beat the expectation of 62.4 with 62.5. Earlier in the week, the preliminary core consumer price index for March missed the expected (YoY) change of 1.2% with a change of 0.9%. The general CPI for the same period matched the expectation of 1.3%. Consumer Confidence for March matched the expectation of -10.8 while the economic sentiment indicator beat 96 with 101.
In Switzerland, the SVME Purchasing Managers’ Index for March beat the expectation of 64.5 with 66.3. On the other hand, the consumer price index for March missed the (MoM) expectation of 0.4% with a change of 0.3% while the (YoY) figure came in better than expected at -0.2% versus -0.3%. Earlier in the week, the KOF leading Indicator for March beat the expectation of 104.5 with 117.8.
EUR/CHF Technical Analysis (the 60-min Chart)
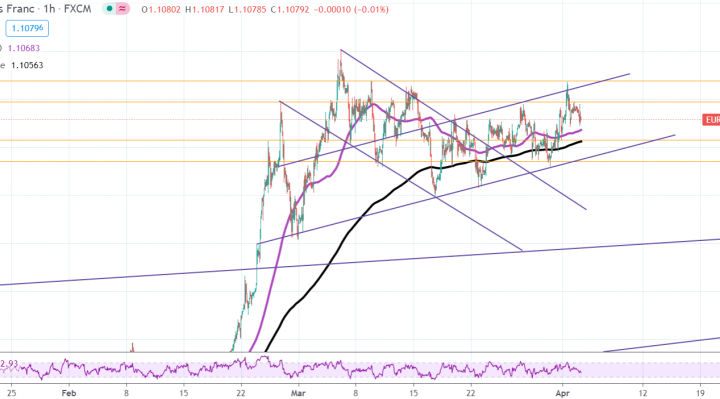
Technically, the EUR/CHF currency pair appears to be trading within a gently ascending channel formation in the 60-min chart. This indicates a slight short-term bullish bias in the market sentiment.
The bulls will be targeting short-term profits at around 1.1097 or higher at 1.1119. On the other hand, the bears will target potential pullback profits at around 1.1057 or lower at 1.1035.
EUR/CHF Technical Analysis (the Daily Chart)
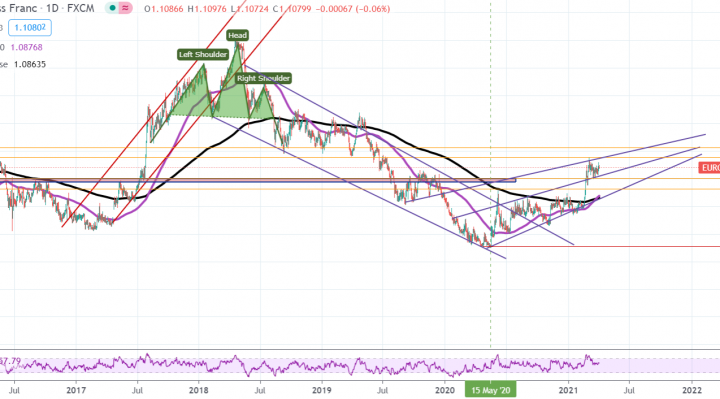
In the daily chart, the EUR/CHF currency pair appears to be trading within a gently ascending wedge formation. It has recently spiked to climb to the higher section of the wedge after a bull-run. The recent pullback pushed it back to the normal trading zone of the 14-day RSI.
The bears will be looking to extend the current pullback towards 1.1004 or lower to 1.0926. On the other hand, the bulls will look to pounce for profits at around 1.1153 or higher at 1.1224.