
AAPL Long-term outlook
The movement of AAPL stock in January extremely positive as the stock printed price above $120 and the rally continue in February with a gap above 123.82 (18-month high). The company reported better than expected revenue $78.4 billion vs. $77.4 billion consensuses, and EPS of $3.36 vs. $3.23 expected.
Apple announces their plan to begin iPhone assembly in India earliest at the end of April this year. The plan could bolster the company revenue from iPhone sales as matured market such as China under slow down.

Click here to read January 2017 analysis
New Month
Monthly chart
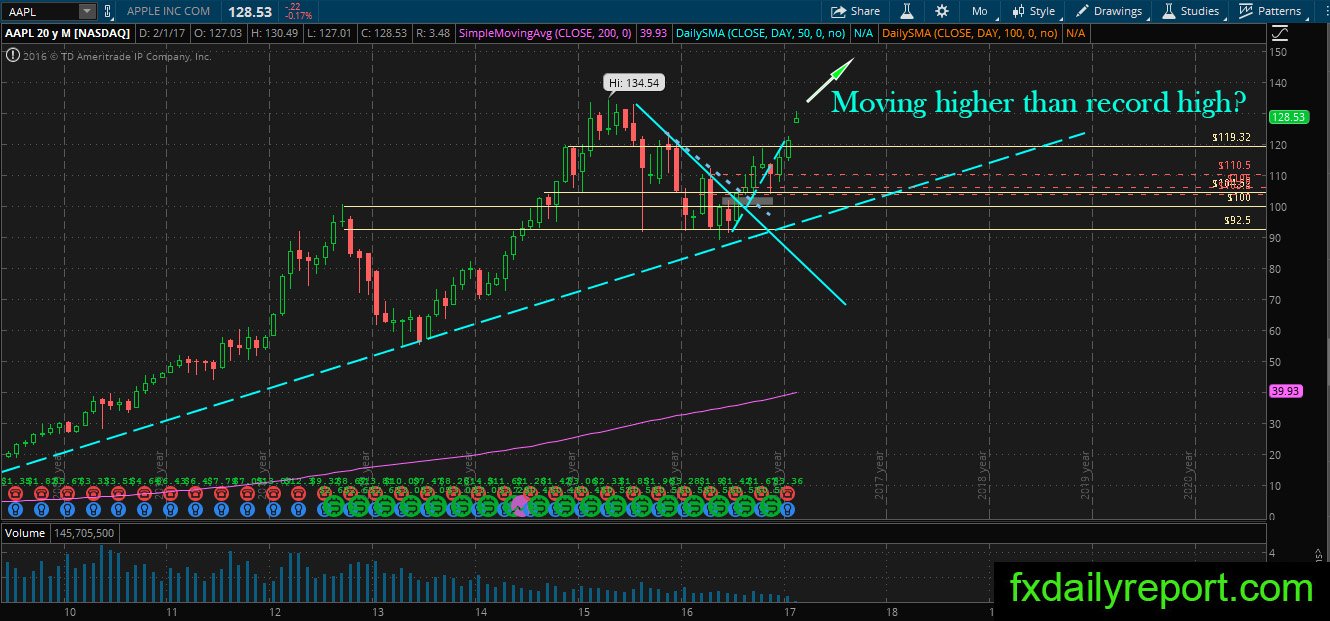
More upward movement in AAPL stock as the price gapped at the start of February. Gap usually filled which will provide an opportunity for the trader who misses the long chance in AAPL. There is possibility AAPL will continue its movement past the 134.54 record high, but fundamental shakeout from President Trump travel ban might influence the company operational in the future.
Also, there is a possibility of higher taxes for the worldwide operation which employ foreign people soon which might put pressure on the company.
Weekly chart

Upward movement in the weekly chart produces one bearish pin bar in the previous week. The candlestick blasted above $120 resistance and looked to continue its upward movement. If the price decided to move down, $120 would act as a support level.
Daily chart
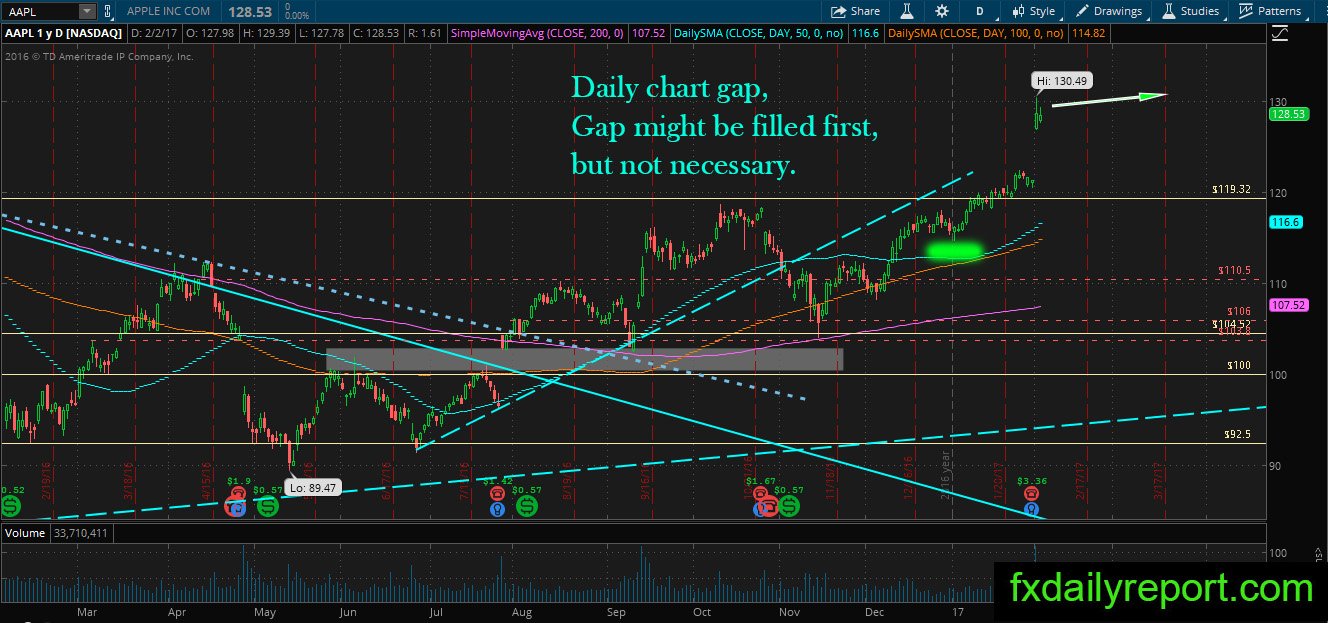
The gap in AAPL price cheered by the bull, but at the current level, it is not tradeable except traders want to accept higher risk. The gap in Daily chart most of the time filled, but in AAPL case it might not move down before continuing up toward the record high. A bull trader needs to wait until the price reached $120 to re-enter long position.
Trade plan
The long position needs to wait and see if price moves down toward $120.
The short position needs to stay sideline for a while until strong bearish confirmation.