
AAPL Long-term outlook
Return of the bullish warrior in AAPL defying all bearish odds in the share price. AAPL movement mostly positive in December 2016, the price reached low $108.25 on the third day of December, reverse its course to upward and unstoppable until $118.02.
There is high odds AAPL will continue its bullish movement in January 2017.

Rumor said AAPL seeking for iPhone production in India, and some sources said the company might be able to produce as soon as the end of 2017. This news is great for iPhone lover in India as it can reduce the cost to acquire iPhone (Note: India consumer need to pay 12.5% import tax).
Click here to read December 2016 analysis
New Month
Monthly chart

Bullish close in December 2016 place AAPL once again near the $120 resistance. If the momentum continues in January 2017, we will see the price break through the resistance. On the lower side, AAPL still has long-term trendline support which will hold any bearish pressure.
Weekly chart

Upward movement in the weekly chart produces one bearish pin bar in the previous week. The candlestick is insignificant as it is the year end candlestick which is low volume. This week candle started by false breakout below the pin and should sign more strength if it closed as a bullish candlestick.
If the price manage to move lower, $110 will act as next strong support level.
Daily chart
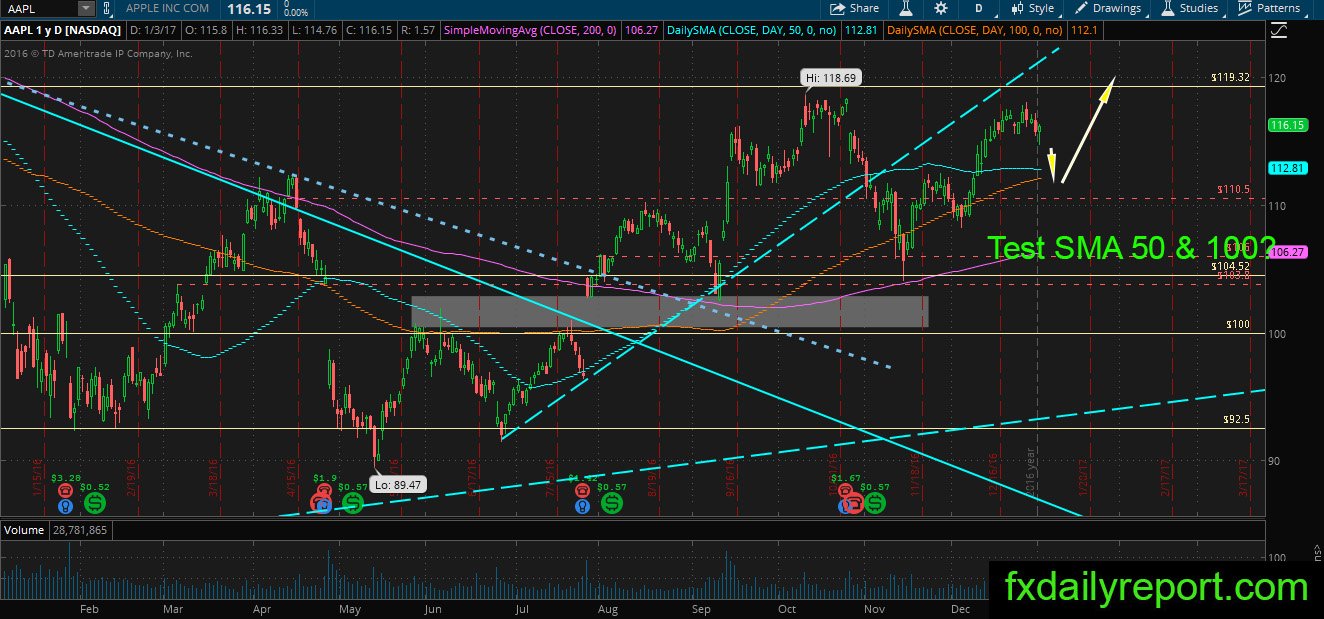
Bullish movement in AAPL triggered when the price bounced from its SMA 200 and SMA 100. The price currently near the $120 resistance, will it reversed and looking for support near the SMA 50 & 100?
Trade plan
The long position could wait until the price moves down and successfully test the SMA 50 or 100. Another possible long position is a break and re-test $120.
The short position bests taken when the price failed to break $120 and formed a bearish pattern.