
The AUD/USD currency pair on Friday bounced off the key support level at 0.7683 to the above 0.7700 after the latest round of US data. The currency pair appears to be trading within a descending wedge formation in the 60-min chart.
The pair dropped several levels below the 100-hour moving average after finding resistance at 0.7754. Friday’s late rebound pushed the currency pair from oversold levels back to the normal trading zone.
AUD/USD Fundamentals Overview

From a fundamental perspective, the AUD/USD currency pair is trading at the back of a relatively busy period in the US market. On Friday, the Chicago Purchasing Managers’ Index for May beat the expectation of 68 with 75.2. On the other hand, the Michigan Consumer Sentiment Index matched the expectation of 82.9. Earlier in the day, personal income for April came in better than expected with a change of -13.1% compared to an expectation of -14.1% (MoM). Personal spending for the period matched the expectation of 0.5% while the core personal consumption expenditures price index was in line with 0.6% (MoM).
Earlier in the week, the preliminary core personal consumption expenditures for Q1 beat the expected (QoQ) change of 2.3% with a change of 2.5%. Preliminary annualized GDP for Q1 missed 6.5% with 6.4%. The (MoM) equivalent beat 4.1% with 4.3%. Durable goods orders came short of 0.7% with -1.3%. Durable goods orders ex-transportation outperformed 0.8% with 1.0% while nondefense capital goods orders ex-aircraft outshone 0.8% with 2.3%. Initial jobless claims for the week to May 21 also beat 425k with 406k.
AUD/USD Technical Analysis (the 60-min Chart)
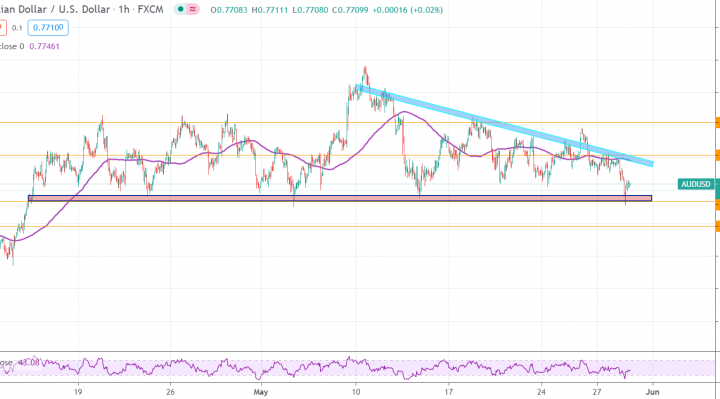
Technically, the AUD/USD currency pair appears to be trading within a downward trending wedge formation in the 60-min chart. This indicates a slight short-term bearish bias in the market sentiment.
The bears will be looking to extend the current declines towards 0.7683 or lower to 0.7645. On the other hand, the bulls will look to pounce for profits at around 0.7754 or higher at 0.7803.
AUD/USD Technical Analysis (the Daily Chart)
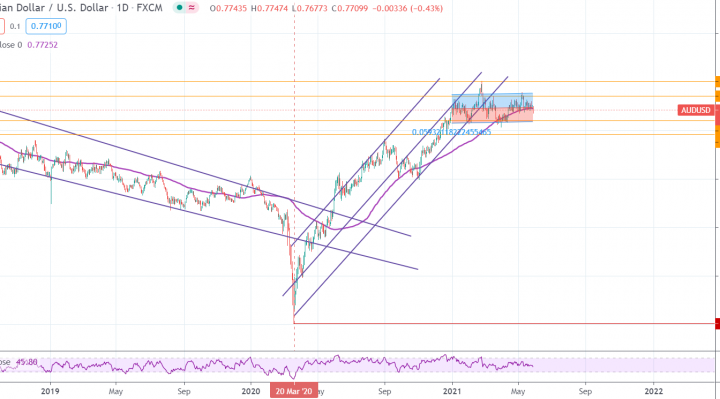
In the daily chart, the AUD/USD currency pair appears to be trading in a sideways channel formation. The pair has recently pulled back to trade closer to the oversold levels of the 14-day RSI.
The bulls will be targeting long-term profits at around 0.7852 or higher at 0.8000. On the other hand, the bears will target more pullbacks at around 0.7596 or lower at 0.7457.