
On Thursday, the AUD/USD currency pair bounced off the session low of about 0.6540 to trade at about 0.6580. The currency pair also completed an upward breakout from a descending channel formation.
The pair has now ascended to trade slightly above the 100-hour moving average line. As a result, the currency pair has rallied closer to the overbought levels of the 14-hour RSI.
AUD/USD Fundamentals Overview

From a fundamental perspective, the AUD/USD currency pair trades during a relatively busy period in both markets. On Thursday, the Australian retail sales for September missed the expectation of 0.3% with a change of 0.1% (MoM).
On Wednesday, the consumer price index for Q3 also fell short of the forecasted rate of 0.3% with a rate of 0.2% (QoQ). The (YoY) equivalent missed 2.9% with a rate of 2.8%. The RBA’s trimmed mean CPI for Q3 fell to 3.5% down from 4% (YoY), in line with expectations. The (QoQ) equivalent also matched expectations after falling to 0.8% from 0.9%.
In the U.S. the initial jobless claims for the week ending October 25 fell significantly lower to 216k down from 228k, in the previous week, beating the estimate of 230k. The employment cost index for Q3 missed the expected change of 0.9% with a change of 0.8%, while the Chicago Purchasing Managers’ Index for October fell short of 47 with a reading of 41.6.
On the other hand, the U.S. personal consumption expenditures – price index for October was in line with the (MoM) and (YoY) expectations of 0.2% and 2.1%, respectively. Personal income for the month matched the forecast of 0.3%, while personal spending beat 0.4% with a change of 0.5%.
AUD/USD Technical Analysis (the 60-min Chart)
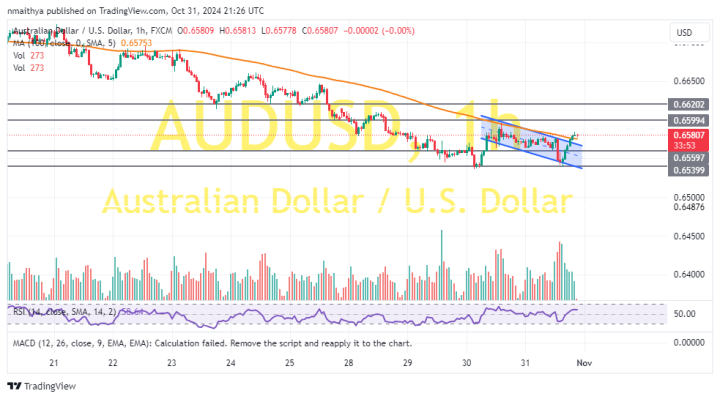
Technically, the AUD/USD currency pair has completed an upward breakout from a descending channel formation. The 14-hour RSI has also bounced back to avoid falling into oversold conditions.
Therefore, the bulls will look to stretch the current rebound towards 0.6599 or higher to 0.6620. On the other hand, the bears will look to pounce on profits at about 0.6559 or lower at 0.6540.
AUD/USD Technical Analysis (the Daily Chart)
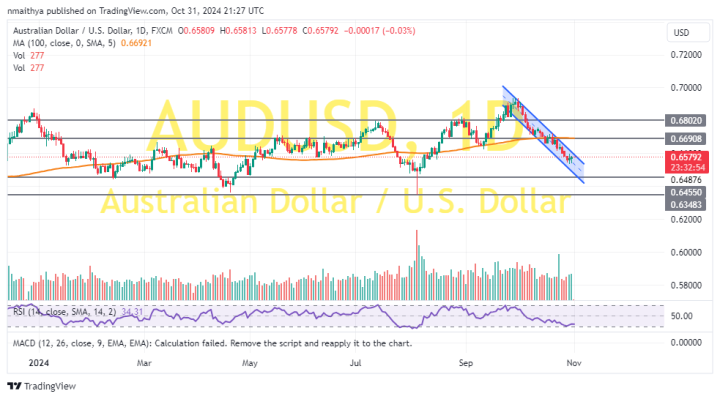
In the daily chart, the AUD/USD currency pair trades within a descending channel formation. The 14-hour RSI also supports a bearish bias as it moves closer to the oversold conditions.
Therefore, the bears will look to extend the current run of declines toward 0.6455 or lower to 0.6348. On the other hand, the bulls will look to pounce on rebounds at about 0.6690 or higher at 0.6802.