
The AUD/USD currency pair on Friday bounced off the day’s session lows of about 0.7220 to top 0.7265 following a week of declines. The currency pair spiked at the start of the week to hit a new 2-month high of about 0.7340 before falling to the current lows.
Friday’s late rebound pushed the currency pair closer to the 100-hour SMA in the 60-min chart. The 200-hour SMA is a few levels below. The pair has also surged closer to the overbought level of the 14-hour RSI.
AUD/USD Fundamentals Overview

From a fundamental perspective, the AUD/USD currency pair is trading at the back of a busy period in the US market. Activity in the Australian market was less this week. On Thursday, Australia’s consumer inflation expectations for November outperformed the estimate of 3.2% with a change of 3.5%. On the other hand, the Westpac consumer confidence for November missed the expected change of 3.8% with 2.5% on Tuesday. The National Australia bank business condition for October improved to 1 versus the previous reading of 0 while the business bank’s business confidence came in 5 versus a previous reading of -4.
In the US, the producer price index for October beat the (MoM) expectation of 0.2% with 0.3%. The (YoY) equivalent came in at 0.5% versus an expectation of 0.4%. On the other hand, the PPI-ex food and energy missed the (MoM) expectation of 0.2% with 0.1% while the (Yoy) equivalent came short of 1.2% with 1.1%. Earlier in the week, the CPI missed expectations on all counts.
AUD/USD Technical Analysis (the 60-min Chart)
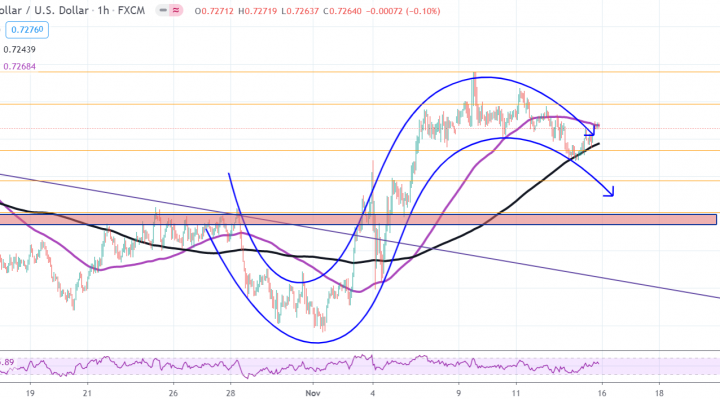
Technically, the AUD/USD currency pair appears to be about to revert to a bearish outlook after enjoying a short bull-run. The pair surged closer to overbought levels of the 14-hour RSI before the latest pullback.
The bears will be looking to extend this pullback towards 0.7235 or lower to 0.7194. On the other hand, the bulls will target short-term rebounds at around 0.7297 or higher at 0.7340.
AUD/USD Technical Analysis (the Daily Chart)
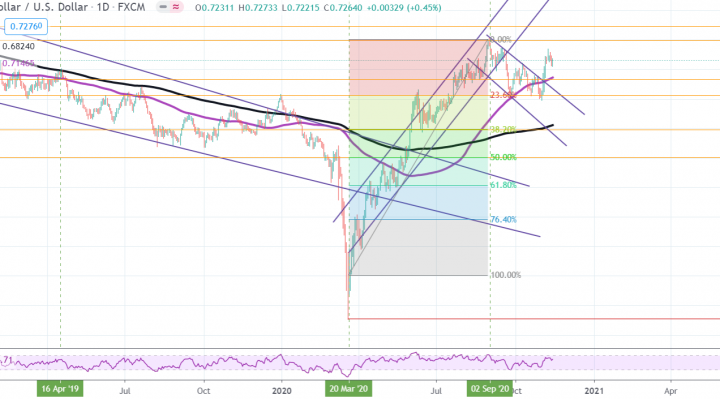
In the daily chart, the AUD/USD currency pair appears to have recently made a bullish breakout from a descending channel. The pair now appears to have resumed the previous bull-trend.
The bulls will be targeting long-term profits at around 0.00% fib level at 0.7400 or higher at 0.7493. On the other hand, the bears will look to pounce for pullback profits at around 0.7133 or lower at the 23.60% fib level at 0.7025.