
The AUD/USD currency pair extended its current mid-week rally to set new monthly highs of about 0.6845 in an upward trending channel. The pair has now ventured into the overbought territory of the 60-min RSI indicator amid increased risk-on trading.
The currency pair has maintained a bullish trend since the start of the month and now looks set to breach the key trendline resistance to surge towards 0.6870 or higher towards 0.6900 in the coming weeks.
AUD/USD Fundamentals Overview

From a fundamental perspective, the AUD/USD currency pair is trading at the back of a relatively positive week in terms of macro-economic events. There is now a breeze of confidence flowing in the financial markets after the US-China trade talks took a positive turn.
Developments in the UK’s separation from the EU are also painting a positive picture and this continues to encourage risk-on trading, which boosts currency pairs like the AUD/USD. The Aussie is highly dependent on the performance of the Chinese economy, which explains this week’s rally.
The latest round of economic data has been a little mixed but generally, the market remains upbeat. CPIs and PPIs of most countries reported this during the week missed expectations while some came in line. While Australia’s unemployment rate edged lower to 5.2% down from 5.3%, the employment change missed expectations of 15k jobs with 14.7k jobs.
The US initial and continuing jobless claims were better than expected but Housing starts missed despite a good performance from housing permits.
AUD/USD Technical Analysis (the 60-min Chart)
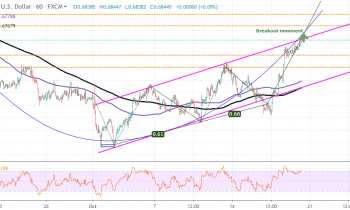
Technically, the AUD/USD currency pair appears to be trading in an ascending channel, which indicates a short-term bullish bias in the market sentiment. The pair has recently hit overbought levels and this suggests that a pullback could be on the cards.
However, with the 3-drivers pattern formation heading for completion, it looks like the more likely outcome will be a breach of the current trendline support which will create short-term bullish opportunities at around 0.6870 and 0.6890. On the other hand, the bears will target profits at around 0.6820 and 0.6800.
AUD/USD Technical Analysis (the Daily Chart)
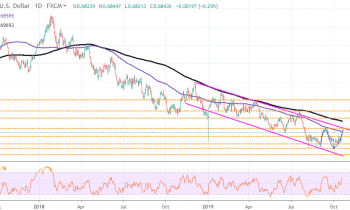
In the daily chart, the AUD/USD currency pair still appears to be trading in a descending channel, which indicates a long-term bearish bias in the market sentiment. The pair is testing the 100-day SMA, which could trigger a pullback, but the RSI shows that there is still some room to run upwards.
Therefore, the bulls will target long-term profits at around 0.7000 or higher at 0.7070 while the bears will look to pounce at around 0.6718 and 0.6670.
In summary, the AUD/USD currency pair appears to be trading under strong bullish pressure in the short-term, but in the long-term, the bears retain control.