
On Friday, the AUD/USD currency pair pulled back off the session high of about 0.6766 to trade at about 0.6684. The pair has completed a downward breakout from an ascending channel formation in the 60-minute chart.
Friday’s pullback pushed the currency pair a few levels below the 100-hour moving average line. As a result, the pair is on the verge of entering the overbought levels of the 14-hour RSI.
AUD/USD Fundamentals Overview

From a fundamental perspective, the AUD/USD currency pair trades during a relatively busy period in both markets. On Friday, the US nonfarm payrolls for August increased to 145k, up from 89k in July, missing the forecasted tally of 160k. The unemployment rate for the month edged slightly lower to 4.2%, down from 4.3% in the preceding month, in line with expectations.
On the other hand, the average hourly wage growth was 0.3% (MoM) and 3.8% (YoY) versus forecasted growth rates of 0.3% and 3.7%, respectively. On Thursday, the ISM Services PMI for August beat expectations of 51.1 with a reading of 51.6, while the ADP employment change for the month missed 145k with a tally of 99k.
In Australia, the gross domestic product for Q2 missed the expected (QoQ) change of 0.3% with a change of 0.2%. The (YoY) equivalent was in line with the estimate of 1%. Elsewhere, the Judo Bank Services PMI for August beat the expectation of 52.2 with a reading of 52.5, while the composite PMI for the period outshone 51.4 with a reading of 51.7. The Australian Building Permits for July exceeded the forecasted change of 2.5% with a change of 10.4% (MoM).
AUD/USD Technical Analysis (the 60-min Chart)
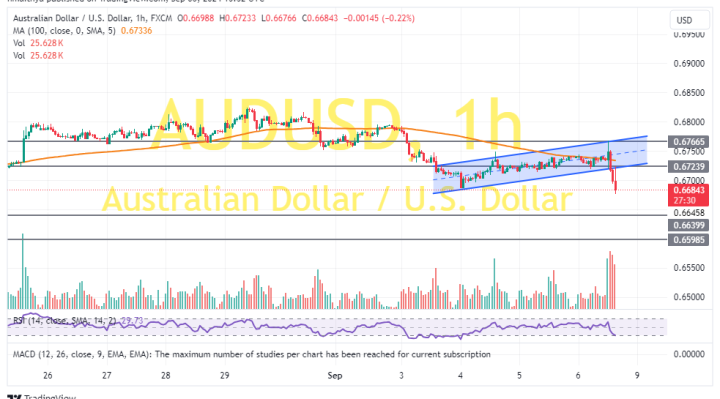
Technically, the AUD/USD currency pair has completed a downward breakout from an ascending channel formation. The 14-hour RSI has also pulled back to move closer to oversold conditions.
Therefore, the bears will look to extend the current pullback towards 0.6640 or lower to 0.6598. On the other hand, the bulls will look to pounce on rebounds at about 0.6724 or higher at 0.6766.
AUD/USD Technical Analysis (the Daily Chart)
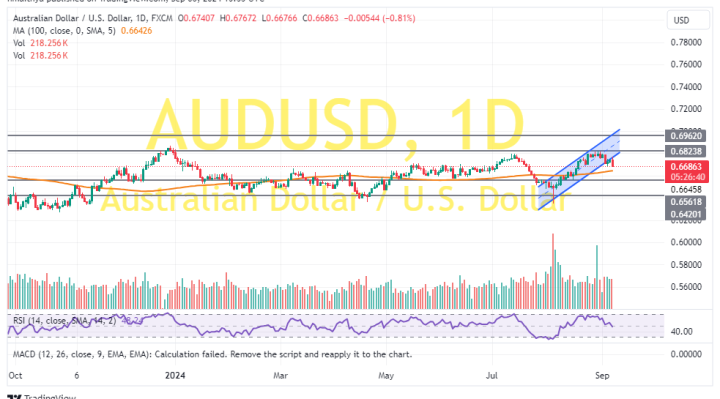
In the daily chart, the AUD/USD has completed a downward breakout from an ascending channel formation. The 14-day RSI has also pulled back to avoid rallying into overbought conditions.
Therefore, the bears will target long-term pullbacks at about 0.6561 or lower at 0.6420. On the other hand, the bulls will look to pounce on profits at about 0.6823 or higher at 0.6962.