
The AUD/USD currency pair on Friday experienced a volatile trading session oscillating between 0.6797 and 0.6900 before finally settling at 0.6860. The currency pair recently performed a triple-top reversal pattern from an ascending channel to send it plunging to the current levels.
This pullback prevented it from venturing into overbought levels of the 14-hour RSI in the 60-min chart. The currency pair now trades below the current levels of the 100-hour and the 200-hour SMA lines.
AUD/USD Fundamental Overview

From a fundamental perspective, the UAD/USD currency pair is trading at the back of a busy period in the US market. This week has been all about police reforms. This comes after continued anti-racism protests against police brutality and racial inequality. The ensuing volatile environment has affected the US market, but the greenback appears to be standing strong. This comes despite a week of mixed US economic data. In addition, the coronavirus spread appears to be spinning up again in the US following the reopening of various states last month.
This week, the US Federal Reserve warned that the unemployment rate could remain in the high single digits for a long period. Current estimates put the lowest unemployment rate this year, post COVID-19 at about 9.3. However, there is still some glimmer of hope as the initial jobless claims continue to outperform estimates. In Australia, home loans for April and Consumer Inflation expectations for June missed the expectations of 0% and 4.2% with -4.4% and 3.3%, respectively.
AUD/USD Technical Analysis (the 60-min Chart)
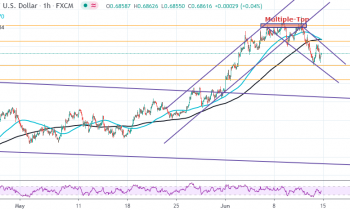
Technically, the AUD/USD currency pair appears to be trading within a sharply diving channel in the 60-min chart. This indicates a short-term bearish bias in the market sentiment. It comes at the back of a multiple-top reversal pattern following a major bull-run.
The bulls will be targeting short-term profits at around 0.6929 or higher at 0.7013. On the other hand, the bears will look to extend the current pullback towards 0.6797 or lower at 0.6719.
AUD/USD Technical Analysis (the Daily Chart)
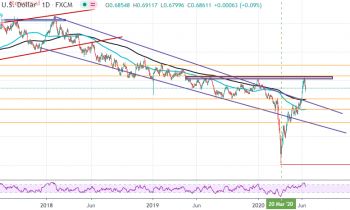
In the daily chart, the AUD/USD currency pair appears to have recently bounced off a strong resistance zone at 0.7077. This triggered the current pullback. The pair had performed a bullish breakout from a descending wedge before facing resistance. It is now back to the normal trading zone off overbought levels of the 14-day RSI.
The bulls will be targeting long-term rebound profits at around 0.7077 or higher at 0.7263. On the other hand, the bears will look to extend the current long-term pullback towards 0.6667 or lower at 0.6488.