
The AUD/USD currency pair on Friday extended the current 2-month gains towards 0.7650 before pulling back late on to settle at 0.7620. The currency pair continues to trade within an ascending channel formation in the 60-min chart. It appears to be enjoying strong support from the 100-hour SMA.
The pair is now on the way back to overbought levels of the 14-hour RSI. It bounced off the boundary to oversold levels in mid-week. It remains several levels above the 200-hour SMA.
AUD/USD Fundamentals Overview

From a fundamental perspective, the AUD/USD currency pair is trading at the back of a relatively busy period in both markets. In Australia, the seasonally-adjusted employment change for November beat the expected job count of 50k with a count of 90k. The seasonally adjusted unemployment rate for the period edged lower to 6.8% down from 7% in October, beating the expectation of the same figure. The participation rate edged higher to 66.1% up from 65.8% in the previous month. The market was expecting a participation rate of 66%.
In the US, the retail sales control group for November missed the expected change of 0.2% with a change of -0.5%. General retail sales also disappointed with a change of -1.1% (MoM) versus the expected change of -0.3%. The US Federal Reserve also kept the base interest rate unchanged at 0.25% during the week. Earlier in the week, the preliminary Markit Manufacturing PMI for beat 55.7 with 56.5. On the other hand, the Services PMI missed 55.9 with 55.3. The Philadelphia Fed Manufacturing Survey for December missed the expectation of 20 with 11.1.
AUD/USD Technical Analysis (the 60-min Chart)
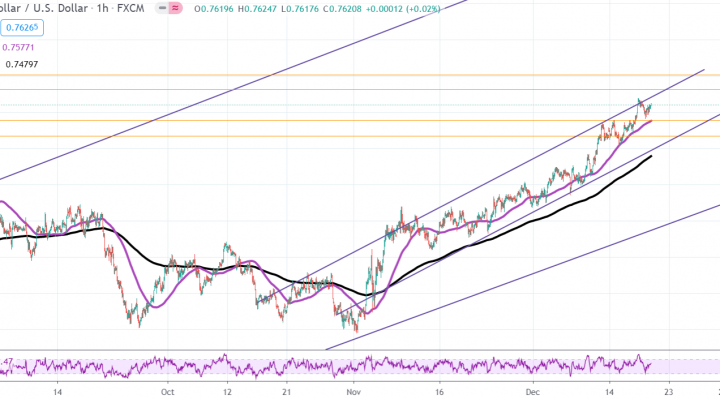
Technically, the AUD/USD currency pair appears to be trading within an ascending channel formation in the 60-min chart. This indicates a short-term bullish bias in the market sentiment.
The bulls will be targeting short-term profits at around 0.7662 or higher at 0.7703. On the other hand, the bears will target short-term pullbacks at around 0.7577 or lower at 0.7534.
AUD/USD Technical Analysis (the Daily Chart)
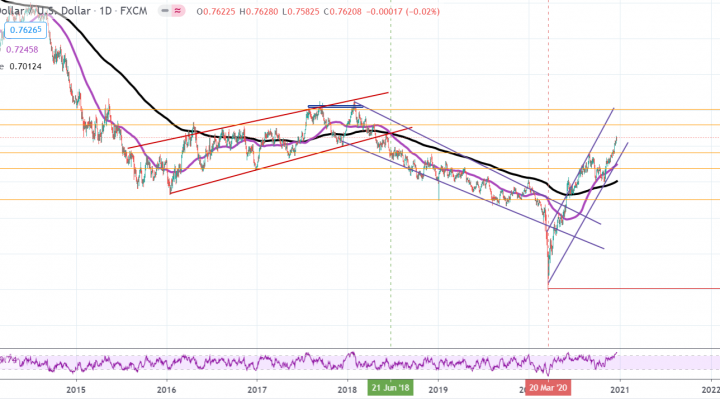
In the daily chart, the AUD/USD currency pair appears to be trading within a sharply ascending channel formation. This indicates a strong long-term bullish bias in the market sentiment.
The bulls will look to extend the current bull-run towards 0.7795 or higher to 0.8019. On the other hand, the bears will look to pounce for long-term profits at around 0.7411 or lower at 0.7188.