
On Friday, the AUD/USD currency pair extended its sideways movement, bouncing off 0.6782 to trade at about 0.6804. The currency pair trades within a slightly ascending channel formation in the 60-minute chart.
The pair continues to trade a few levels above the 100-hour moving average line after the latest data. The currency pair has room on either side of the 14-hour RSI amid a lack of a clear directional bias.
AUD/USD Fundamentals Overview

From a fundamental perspective, the AUD/USD currency pair trades during a relatively busy period in both markets. On Thursday, Australia’s private sector credit for Q2 fell short of the forecasted (QoQ) change of 1% with a change of -2.2%, down from 1.9% in the preceding period.
On the other hand, the monthly consumer price index for July beat the forecasted change of 3.4% with a change of 3.5% (YoY), down from 3.8% in June, while the retail sales data for the month missed the expectation of 0.3% with a change of 0% (MoM) on Friday, down from 0.5% in the preceding month.
In the US, the US initial jobless claims for the week ending August 23 came in slightly lower than expected with 231k versus a forecast of 232k. The preliminary US gross domestic product for Q2 beat the expectation of 2.8% with a change of 3%, up from 2.8%, while the preliminary US gross domestic product price index for the quarter outshone 2.3% with a change of 2.5%.
The preliminary personal consumption expenditure prices for the period missed the expectation of 2.6% with a change of 2.5%, while the core personal consumption expenditure prices fell short of 2.9% with a change of 2.8%.
AUD/USD Technical Analysis (the 60-min Chart)
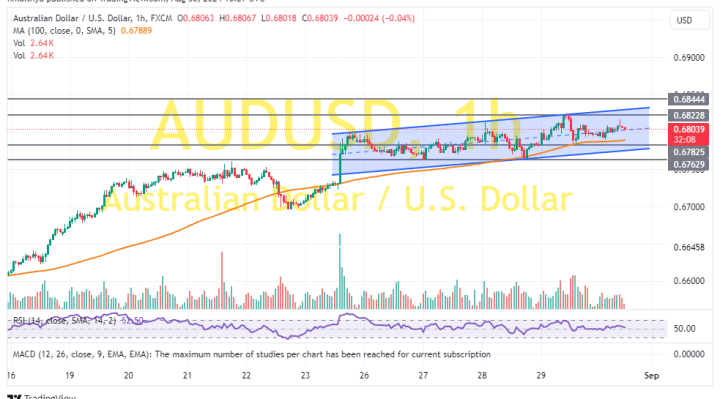
Technically, the AUD/USD currency pair trades within a slightly ascending channel formation in the 60-minute chart. However, the 14-hour RSI has room to swing either side of the indicator creating an opportunity for both the bulls and the bears.
Therefore, the bulls will look to pounce on upward movements at about 0.6822 or higher at 0.6844. On the other hand, the bears will look to pounce on downward movements at about 0.6782 or lower at 0.6763.
AUD/USD Technical Analysis (the Daily Chart)
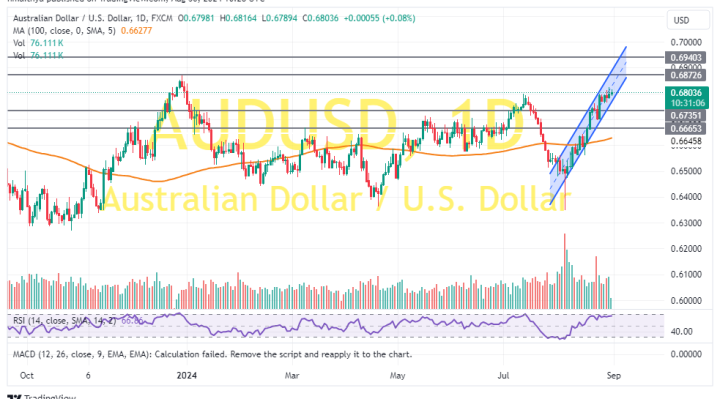
In the daily chart, the AUD/USD currency pair trades within a sharply ascending channel formation. The 14-day RSI also supports a bullish bias after advancing to move closer to overbought conditions.
Therefore, the bulls will look to extend the current gains toward 0.6872 or higher to 0.6940. On the other hand, the bears will look to pounce on profits at about 0.6735 or lower at 0.6665.