
The AUD/USD currency pair on Friday extended the current weekly gains towards the key level at 0.7150 following the latest round of PMI data. The currency pair appears to be on course to completing a XABCD pattern, which could push it above 0.7300.
The currency pair has now crossed above the 100-hour and the 200-hour SMA lines in the 60-min chart. The pair also appears to be heading towards overbought levels of the 14-hour RSI. This could trigger a temporary pullback.
AUD/USD Fundamentals Overview

From a fundamental perspective, the AUD/USD currency pair is trading at the back of a relatively busy period in both markets. In Australia, the preliminary seasonally adjusted retail sales for September improved with the (MoM) change of -1.5% compared to a previous change of -4%. Westpac leading index for September posted a change of 0.22% compared to a previous change of 0.49%.
On Friday, the preliminary commonwealth bank services PMI for October beat the expectation of 50.3 with 53.8. The commonwealth bank manufacturing PMI missed the expectation of 55.5 with 54.2. The preliminary commonwealth bank composite PMI improved to 53.6 up from 51.2.
In the US, the preliminary Markit Manufacturing PMI for October missed the expectation of 53.4 with 53.3. On the other hand, the Services PMI beat the expectation of 54.6 with 56 while the PMI composite improved to 55.5 up from 54.3.
AUD/USD Technical Analysis (the 60-min Chart)
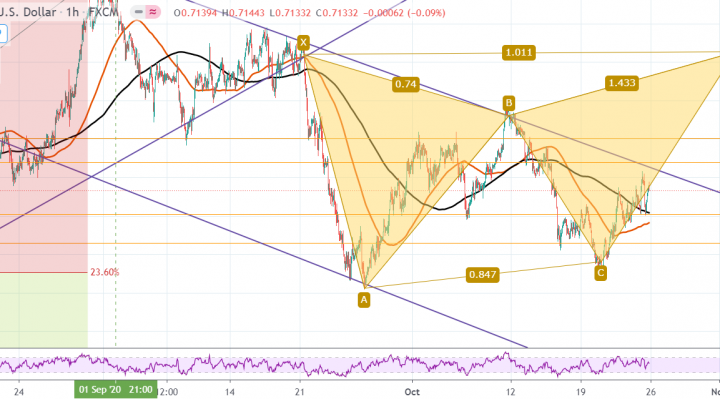
Technically, the AUD/USD currency pair appears to be on course to complete a XABCD double-bottom reversal pattern in the 60-min chart. This indicates an attempt by the bulls to take control of the pair.
They will be targeting short-term profits at around 0.7169 or higher at 0.7200. On the other hand, the bears will look to pounce for profits at around 0.7100 or lower to 0.7065.
AUD/USD Technical Analysis (the Daily Chart)
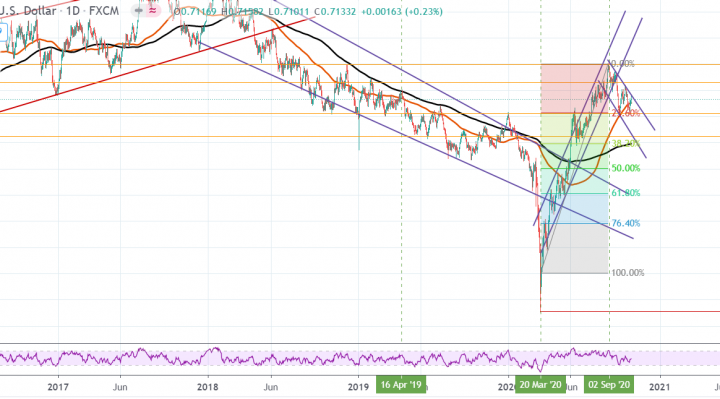
In the daily chart, the AUD/USD currency pair appears to be trading within a sharply descending channel. This comes off a sharply ascending channel, which indicates an attempt by the bears to initiate a long-term reversal in the market.
They will target long-term profits at around23.60% fib level at 0.7024 or lower at 0.6850. On the other hand, the bulls will look to pounce at 0.7260 or higher at 0.00% fib level at 0.7400.