
On Thursday, the AUD/USD currency pair pulled back from the session highs of about 0.6724 to trade at about 0.6697. The currency pair trades within a descending channel formation in the 60-minute chart.
The pair has now fallen to trade a few levels below the 100-hour moving average line. However, the currency pair bounced back later to avoid falling into the oversold levels of the 14-hour RSI.
AUD/USD Fundamentals Overview

From a fundamental perspective, the AUD/USD currency pair trades during a relatively busy period in both markets. On Thursday, Australian exports for November fell by 2.9% (MoM), compared to a growth rate of 2.8% in the previous period.
Imports for the period registered a growth rate of 0.2% (MoM) compared to 2.4% in October. Earlier in the week, building permits for November grew by 15.2% (MoM) versus a forecast of 2%. On the other hand, the consumer price index for the month fell short of the forecasted change of 3.7%, with a change of 3.4%.
In the U.S., the initial jobless claims for last week came in better than expected, with 208k versus a forecast of 210k, up from the previous week’s equivalent of 200k. Earlier in the week, the US ISM Services PMI for December outperformed the expectation of 52.3, with a reading of 54.4.
JOLTS Job Openings for November fell short of the forecasted tally of 7.6 million, with a tally of 7.146 million, down from 7.449 million in October. Factory orders for October also missed the expected (MoM) change of -1.2%, with a change of -1.3%, while the ADP employment change for December failed to match the forecast of 47k, with 41k.
AUD/USD Technical Analysis (the 60-min Chart)
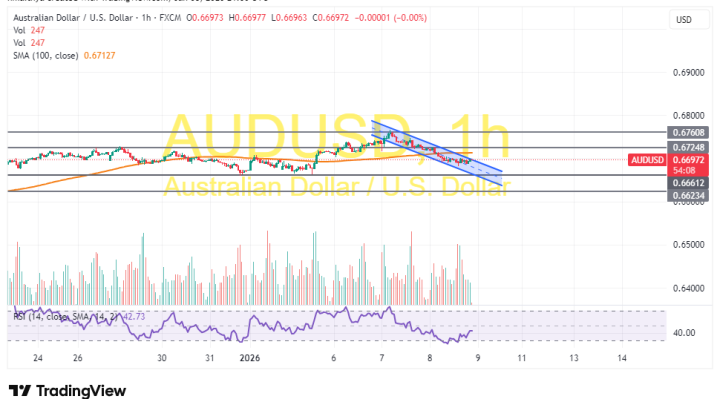
Technically, the AUD/USD currency pair trades within a descending channel formation in the 60-minute chart. However, the 14-hour RSI has recently bounced back to avoid falling into oversold conditions.
Therefore, the bulls will look to stretch the latest rebound towards 0.6724 or higher to 0.6760. On the other hand, the bears will look to pounce on extended declines at about 0.6661 or lower at 0.6623.
AUD/USD Technical Analysis (the Daily Chart)
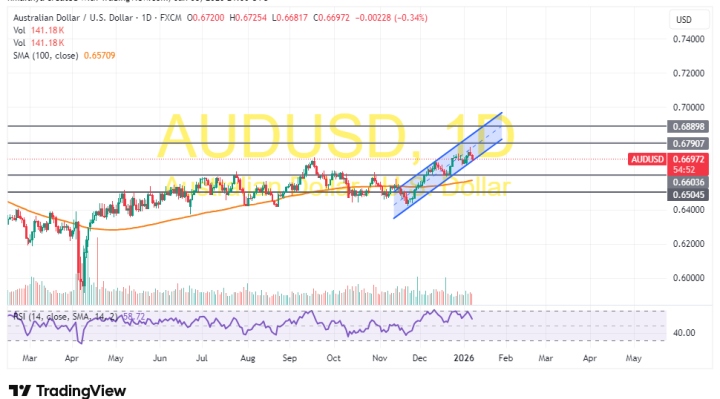
In the daily chart, the AUD/USD currency pair trades within an ascending channel formation. However, the 14-day RSI has recently pulled back to avoid entering overbought conditions.
Therefore, the bears will look to extend the current pullback towards 0.6603 or lower to 0.6504. On the other hand, the bulls will look to ride the current run of gains toward 0.6790 or higher to 0.6889.