
The AUD/USD currency pair on Friday pulled back off Thursday highs of 0.7635 to trade below the 0.7600 level after the US NFPs. The currency pair appears to be trading within a highly volatile descending channel formation in the 60-min chart.
The pair has now dropped to trade below the 100-hour SMA. The 200-hour SMA is a few levels higher. The downward momentum appears to be strong enough to carry on through next week.
AUD/USD Fundamentals Overview

From a fundamental perspective, the AUD/USD currency pair is trading at the back of a relatively busy period in the US market. On Friday, the US non-farm payrolls for March beat the expected job count of 647k with a tally of 916k. On the other hand, the average hourly wage growth for March was 4.2% (YoY). The market was expecting a growth of 4.5%. The unemployment rate edged lower to 6% down from 6.2% in the previous month, in line with expectations.
On Thursday, the US ISM Manufacturing PMI for March beat the expectation of 61.3 with 64.7. The ISM Manufacturing Employment Index and Prices Paid also outshone expectations of 53 and 85, respectively with 59.6 and 85.6. Earlier in the week, the ADP employment change for March came short of 550k with 517k.In Australia, the trade balance for February missed the (MoM) expectation of 9700M with 7529M. On the other hand, the seasonally adjusted retail sales beat the expected change of -1.1% (MoM) with -0.8%.
AUD/USD Technical Analysis (the 60-min Chart)
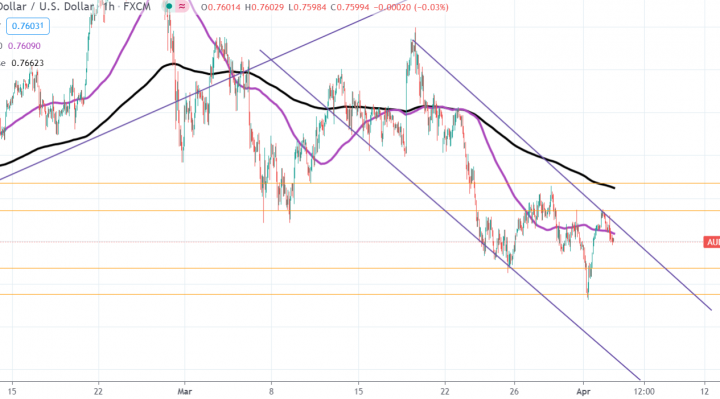
Technically, the AUD/USD currency pair appears to be trading within a sharply descending channel formation in the 60-min chart. This indicates a strong short-term bearish bias in the market sentiment.
The bears will look to extend the current downward movement towards 0.7568 or lower to 0.7537. On the other hand, the bulls will target short-term rebounds at around 0.7635 or higher at 0.7667.
AUD/USD Technical Analysis (the Daily Chart)
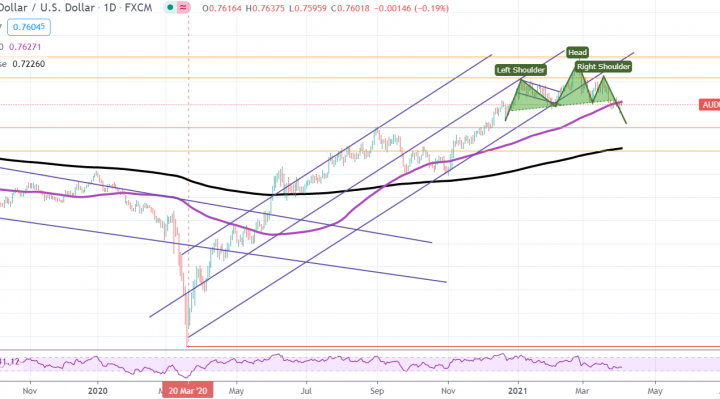
In the daily chart, the AUD/USD currency pair appears to have recently pulled back after a strong rally. The pair made a bearish breakout in a head-and-shoulders pattern formation that is nearing completion. It is now closer to the oversold levels of the 14-day RSI.
The bulls will be targeting long-term profits at around 0.7832 or higher at 0.8017. On the other hand, the bears will look to pounce for profits at around 0.7405 or lower at 0.7200.