
The AUD/USD currency pair on Friday pulled back off the current 10-day highs to trade at around 0.7160 following the latest round of US data. The currency pair continues to trade within an ascending channel in the 60-min chart.
It remains pinned above the 100-hour and the 200-hour SMA lines. It is currently within the normal trading zone of the 14-hour RSI after last week’s rebound.
AUD/USD Fundamentals Overview

From a fundamental perspective, the AUD/USD currency pair is trading at the back of a relatively busy period in the US market. On Friday, the US non-farm payrolls for September missed the expectation of 850k jobs with a tally of 661k jobs. The average hourly earnings growth also came short of the (YoY) estimate with 4.7% versus 4.8% while the unemployment rate impressed with 7.9% versus the market expectation of 8.2%. This was a significant improvement from August’s unemployment rate of 8.4%.
Workforce capacity utilization for September came in at 61.4% compared to an expectation of 61.5% after edging lower from August’s participation rate of 61.7%. The Michigan Consumer Sentiment Index for September beat the expectation of 79 with 80.4 while factory orders for August missed the (MoM) expectation of 1% with 0.7%.
In Australia, the seasonally adjusted retail sales for August beat the (MoM) expectation of -4.2% with a change of -4%. Earlier in the week, building permits for August missed the (MoM) expectation of 0.0% with a change of -1.6%.
AUD/USD Technical Analysis (the 60-min Chart)
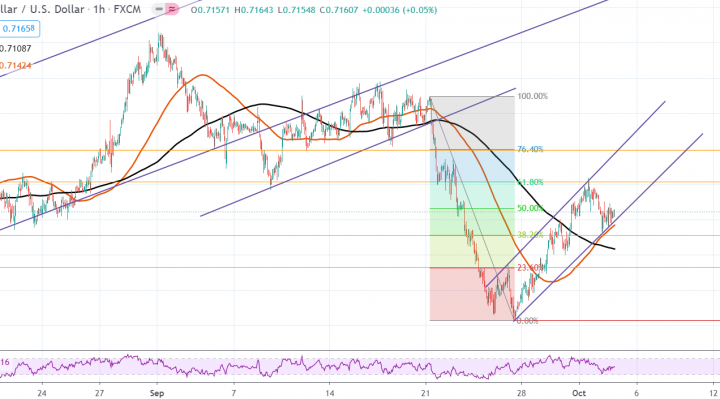
Technically, the AUD/USD currency pair appears to be trading within ana ascending channel in the 60-min chart. This indicates a significant short-term bullish bias in the market sentiment.
The bulls will be targeting short-term profits at around 61.80% and 76.40% fib levels at 0.7203 and 0.7248, respectively. On the other hand, the bears will look to pounce for profits at around 38.20% and 23.605 fib levels at 0.7127 and 0.7082, respectively.
AUD/USD Technical Analysis (the Daily Chart)
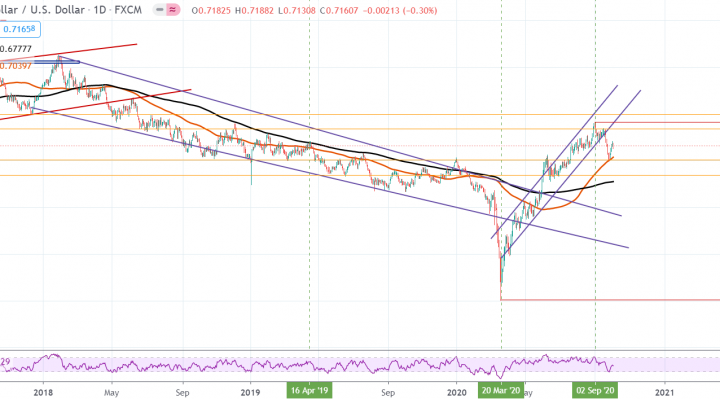
In the daily chart, the AUD/USD currency pair appears to have recently bounced off the 100-day SMA support after breaking out of an ascending channel. This indicates an attempt by the bears to take long-term control. But the bulls remain resilient.
The bears will target long-term profits at around 0.7006 or lower at 0.6847. On the other hand, the bulls will look to pounce for profits at around 0.7339 or higher at 0.7498.