
AUD/USD currency pair on Friday found support around the 0.7060 level after pulling back off 15-month highs of 0.7182 earlier in the week. The currency pair continues to trade within a slightly ascending channel in the 60-min chart.
It recently completed the formation of a bullish triangle pattern which resulted in a breakout. The pair is pinned to the 100-hour SMA while the 200-hour SMA is a few pips below.
AUD/USD Fundamentals Overview

From a fundamental perspective, the AUD/USD currency pair is trading at the back of a relatively busy period in both markets. Earlier in the week, Australia’s Westpac leading index for June came in at 0.44% (MoM) up from 0.2% in the previous period. However, the preliminary adjusted retail sales for June missed the (MoM) expectation of 7.1% with 2.4%. On Thursday, the preliminary commonwealth bank services PMI for July beat 53.2 with 58.5. On the other hand, the manufacturing PMI came short of 53.6 with 53.4.
In the US, the housing price index for May missed 0.3% with -0.3% (MoM). The existing home sales for June also came short of 4.78M with 4.72M (MoM) while existing home sales change failed to meet 24.5% with 20.7% over the same period. On Thursday, initial jobless claims missed expectations while continuing claims outperformed. The preliminary Markit Manufacturing and Services PMIs came short of expectations on Friday while new home sales delivered better than expected.
AUD/USD Technical Analysis (the 60-min Chart)
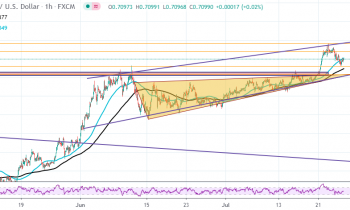
Technically, the AUD/USD currency pair appears to have recently made an upward breakout off a consolidative triangle formation in the 60-min chart. This indicates a short-term bullish bias in the market sentiment. However, the recent pullback could halt the uptrend.
The bulls will be targeting short-term profits at around 0.7140 or higher at 0.7182. On the other hand, the bears will look to pounce for profits at around 0.7061 or lower at 0.7016.
AUD/USD Technical Analysis (the Daily Chart)
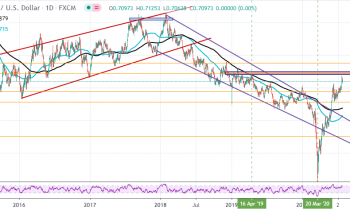
In the daily chart, the AUD/USD currency pair appears to be facing strong resistance around the 0.7200 level. The pair recently spiked through the descending wedge to recover all the losses made earlier in the year. It has since surged to new 15-month highs.
The pair has already crossed to overbought levels of the 14-day RSI. Therefore, the bears will target pullback profits at 0.6946 or lower at 0.6781. On the other hand, the bulls will look to pounce at 0.7223 or higher at 0.7378.