
On Friday, the AUD/USD currency pair pulled back from the current 2-month highs of about 0.6400 to trade at 0.6375. The currency pair trades within a sideways channel formation in the 60-minute chart.
The pair continues to trade slightly above the 100-hour moving average line. As a result, the currency pair still has plenty of room to run before reaching the overbought levels of the 14-hour RSI.
AUD/USD Fundamentals Overview

From a fundamental perspective, the AUD/USD currency pair trades during a relatively busy period in both markets. On Thursday, March’s seasonally adjusted Australian unemployment rate increased to 4.1%, up from 4% in February, beating the forecast of 4.2%.
On the other hand, the seasonally adjusted employment change for the period missed the forecast of 40k with 32.2k, up from the previous month’s equivalent of -57.5k, while the participation rate edged slightly higher to 66.8%, up from 66.7% in February missed the expected rate of 67%.
In the U.S., building permits for March came in better than expected with 1.482 million versus a forecast of 4.5 million, up from the previous month’s equivalent of 4.459 million. On the other hand, the housing starts for the month fell short of 1.42 million with a tally of 1.324 million, down from 1.494 million in February.
Elsewhere, the Philadelphia Fed Manufacturing Survey for April missed the expectation of 2 with a reading of -26.4, down from 12.5 in March. The initial jobless claims for the week ending April 11 beat the forecast of 225k with 215k, down from the preceding week’s equivalent of 224k.
AUD/USD Technical Analysis (the 60-min Chart)
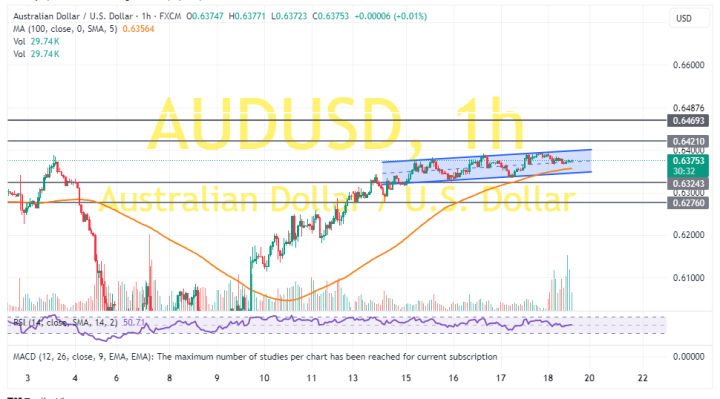
Technically, the AUD/USD currency pair trades within a sideways channel formation in the 60-minute chart. The 14-hour RSI remains central, leaving enough space for both the bulls and the bears to pounce.
Therefore, the bulls will target potential upward movements at about 0.6421 or higher at 0.6469. On the other hand, the bears will look to pounce on profits at about 0.6324 or lower at 0.6276.
AUD/USD Technical Analysis (the Daily Chart)
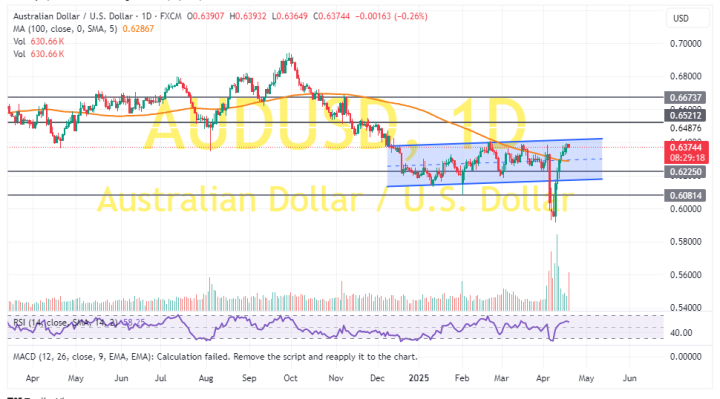
In the daily chart, the AUD/USD currency pair also trades within a sideways channel formation. However, the pair has recently bounced back to move closer to the overbought conditions of the 14-day RSI.
Therefore, the bulls will look to stretch the current rebound towards 0.6521 or higher to 0.6673. On the other hand, the bears will look to pounce on pullbacks at about 0.6225 or lower at 0.6081.