
The AUD/USD currency pair on Friday pulled back after hitting a new 6-week high of 0.7290 to trade at 0.7257. The currency pair had rallied during the week after completing a XABCD double-bottom reversal pattern.
The pair is now trading several levels above the 100-hour and the 200-hour SMA lines in the 60-min chart. Friday’s pullback pushed it back to the normal trading zone of the 14-hour RSI after crossing to overbought levels earlier in the week.
AUD/USD Fundamentals Overview

From a fundamental perspective, the AUD/USD currency pair is trading at the back of a relatively busy period in the US market. On Friday, the US non-farm payrolls for October beat the expectation of 600k jobs with 638k jobs. The unemployment rate for the period also edged lower to 6.9% down from 7.9% in the previous month. The market was expecting a rate of about 7.7%. On the other hand, the average hourly wage for the period missed the (YoY) expectation of 4.6% with a change of 4.5%. The (MoM) equivalent also came short of the expectation of 0.2% with 0.1%.
Retail sales for September beat the (MoM) expectation of -1.5% with a change of -1.1% on Wednesday. On Thursday, imports for September fell 5.9% (MoM) compared to an increase of 1.3% in the previous month. On the other hand, exports increased by 3.9% compared to a decline of 4.1% in the previous month. Trade balance for September also rose by 5.63 billion compared to a change of 2.618 billion (MoM) in the previous period.
AUD/USD Technical Analysis (the 60-min Chart)
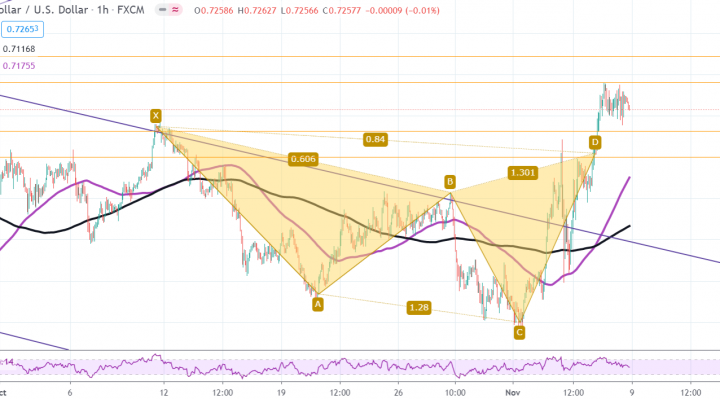
Technically, the AUD/USD currency pair on Friday pulled back off the current 6-week highs of 0.7290 after suffering momentum exhaustion. The pair has now pulled back to the normal trading zone of the 14-hour RSI in the 60-min chart.
The bulls will be targeting short-term profits at around 0.7290 or higher at 0.7322. On the other hand, the bears will look to pounce for profits at around 0.7231 or lower at 0.7200.
AUD/USD Technical Analysis (the Daily Chart)

In the daily chart, the AUD/USD currency pair appears to be trading in a sharply rising curve from a sharply descending channel. This indicates an attempt by the bulls to retake control after the recent pullback. The pair has now rallied close to overbought levels of the 14-day RSI.
The bulls will be targeting long-term profits at around 0.00% Fib level at 0.7400 or higher at 0.7493. On the other hand, the bears will look to pounce for profits at around 0.7133 or lower at 23.60% fib level at 0.7025.