
On Friday, the AUD/USD currency pair pulled back from the session highs of about 0.6453 to trade at about 0.6384 after the US nonfarm payrolls. The currency pair trades within a descending channel formation in the 60-minute chart.
The pair has now plummeted to trade a few levels below the 100-hour moving average line. As a result, the currency pair is on the verge of entering the oversold levels of the 14-hour RSI.
AUD/USD Fundamentals Overview

From a fundamental perspective, the AUD/USD currency pair trades during a relatively busy period in both markets. On Friday, the U.S. nonfarm payrolls for November rose to 227k, up from 36k in October, beating the forecasted tally of 200k. The average hourly wage growth for the month also exceeded expectations of 0.3% (MoM) and 3.9% (YoY), with changes of 0.4% and 4%, respectively.
On the other hand, the unemployment rate for the period increased slightly to 4.2%, up from 4.1%, in line with estimates. The preliminary Michigan Consumer Sentiment Index for December rose to 74, up from 71.8 in November, beating the forecast of 73. The preliminary UoM 5-year consumer inflation expectations edged slightly lower to 3.1%, down from 3.2%.
In Australia, the trade balance for October outperformed the expectation of 4,500 million with 5,953 million, up from the preceding month’s equivalent of 4,532 million. Exports and Imports also improved with changes of 3.6% and 0.1%, respectively versus -4.7% and -2.8% in the preceding period. The Australian gross domestic product for Q3 missed the (QoQ) and (YoY) forecasts of 0.4% and 1.1%, respectively with changes of 0.3% and 0.8%.
AUD/USD Technical Analysis (the 60-min Chart)
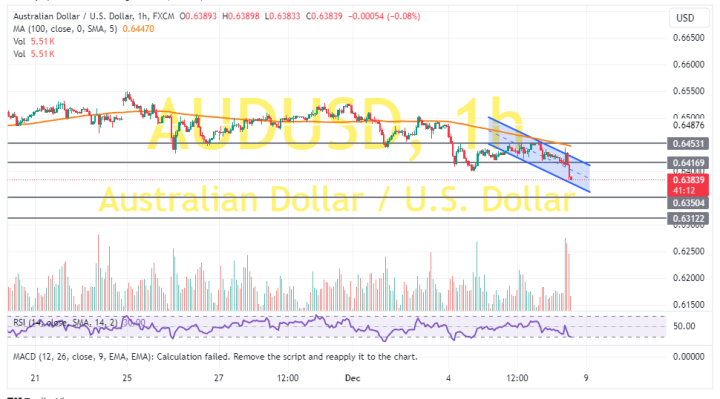
Technically, the AUD/USD currency pair trades within a descending channel formation in the 60-minute chart. The 14-hour RSI has also pulled back to trade closer to the oversold conditions.
Therefore, the bears will look to stretch the current declines toward 0.6350 or lower to .6312. On the other hand, the bulls will look to pounce on rebounds at about 0.6417 or higher at 0.6453.
AUD/USD Technical Analysis (the Daily Chart)
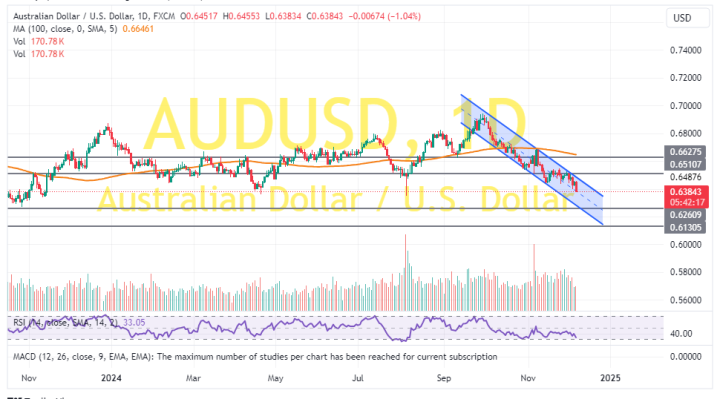
In the daily chart, the AUD/USD currency pair trades within a descending channel formation. The 14-day RSI also supports a long-term bearish bias as it moves closer to the oversold conditions.
Therefore, the bears will look to ride the current run of declines toward 0.6260 or lower to 0.6130. On the other hand, the bulls will look to pounce on rebounds at about 0.6510 or higher at 0.6627.