
On Friday, the AUD/USD currency pair pulled back from the session highs of about 0.6517 to trade at about 0.6494 after the latest data. The currency pair trades within a sideways channel formation in the 60-minute chart.
Friday’s pullback pushed the pair slightly below the 100-hour moving average line. However, the currency pair still has room left to run before reaching the oversold levels of the 14-hour RSI.
AUD/USD Fundamentals Overview

From a fundamental perspective, the AUD/USD currency pair trades during a relatively busy period in both markets. On Friday, Australia’s preliminary S&P Global Composite PMI for October came in at 52.6. The Services PMI for the period was 49.7, while the Manufacturing PMI was 53.1.
In the U.S., Congress failed to pass a bill to pay Federal essential workers, extending the ongoing government shutdown to make the second-longest in U.S. history. In the latest U.S. economic data, existing home sales for September missed the expectation of 4.1 million with a tally of 4.06 million, up from 4 million. The existing home sales change for the period also improved with a change of 1.5% versus -0.2% in the previous period.
Looking forward, traders will be waiting for the U.S. consumer price index data and the preliminary S&P Global Composite, Manufacturing, and Services PMI data for October, later on Friday.
AUD/USD Technical Analysis (the 60-min Chart)
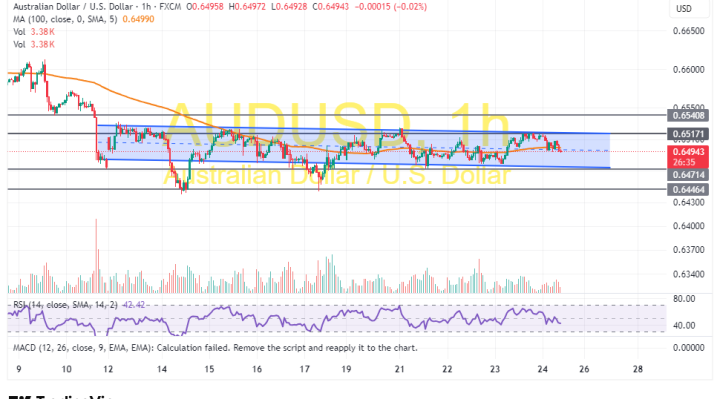
Technically, the AUD/USD currency pair trades within a sideways channel formation in the 60-minute chart. However, the 14-hour RSI has recently pulled back to avoid rallying into overbought conditions.
Therefore, the bears will look to extend the current pullback towards 0.6471 or lower to 0.6446. On the other hand, the bulls will look to pounce on rebounds at about 0.6517 or higher at 0.6540.
AUD/USD Technical Analysis (the Daily Chart)
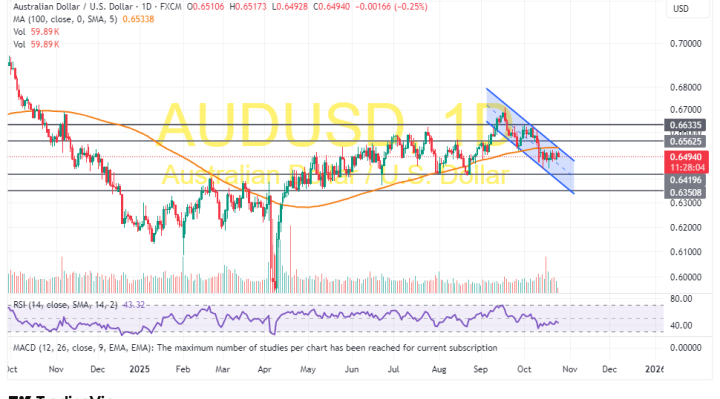
In the daily chart, the AUD/USD currency pair trades within a descending channel formation. However, the 14-day RSI has recently bounced back to avoid falling into oversold conditions.
Therefore, the bulls will look to stretch the current rebound towards 0.6562 or higher to 0.6633. On the other hand, the bears will look to ride the current run of declines toward 0.6419 or lower to 0.6350.