
On Thursday, the AUD/USD currency pair pulled back off session highs of about 0.6610 to trade at about 0.6579. The currency pair continues to trade within a highly volatile sideways channel formation in the 60-minute chart.
Thursday’s pullback pushed the currency pair slightly below the 100-hour moving average line. The pullback also prevented the pair from rallying into the overbought levels of the 14-hour RSI.
AUD/USD Fundamentals Overview

From a fundamental perspective, the AUD/USD currency pair is trending at the back of a relatively busy period in the US market. On Thursday, the preliminary annualised US gross domestic product for Q4 outperformed the expectation of 2% with a change of 3.3%.
The preliminary core consumption expenditures price index for the period matched the expected (QoQ) change of 2%, unchanged from the previous period. The initial jobless claims for the week ending January 19 missed the expectation of 200k with a significantly higher tally of 214k.
Elsewhere, the durable goods orders for December missed the expected change of 1.1% with a change of 0%. On the other hand, the durable goods orders ex-transportation for the period beat the estimate of 0.2% with a change of 0.6%, while the durable goods orders ex-defence missed the forecast of 1.1% with a change of 0.5%. The nondefense capital goods orders for the period exceeded the estimated change of 0.1% with a change of 0.3%.
AUD/USD Technical Analysis (the 60-min Chart)
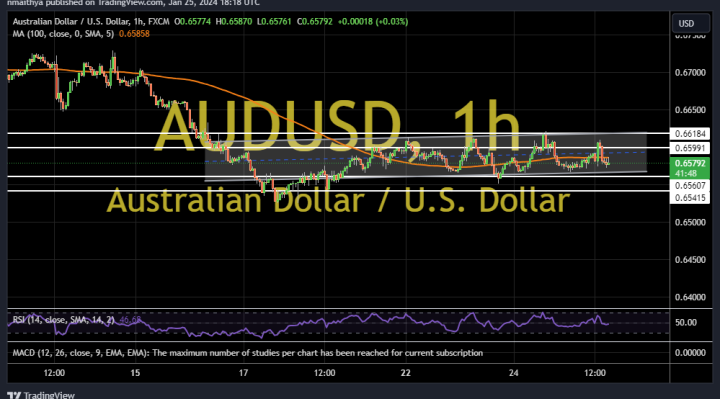
Technically, the AUD/USD currency pair appears to be trading within a sideways channel formation in the 60-minute chart. The 14-hour RSI recently pulled back to avoid rallying into overbought conditions.
Therefore, the bears will be targeting extended pullbacks at about 0.6560 or lower at 0.6541. On the other hand, the bulls will look to pounce on rebounds at about 0.6599 or higher at 0.6618.
AUD/USD Technical Analysis (the Daily Chart)
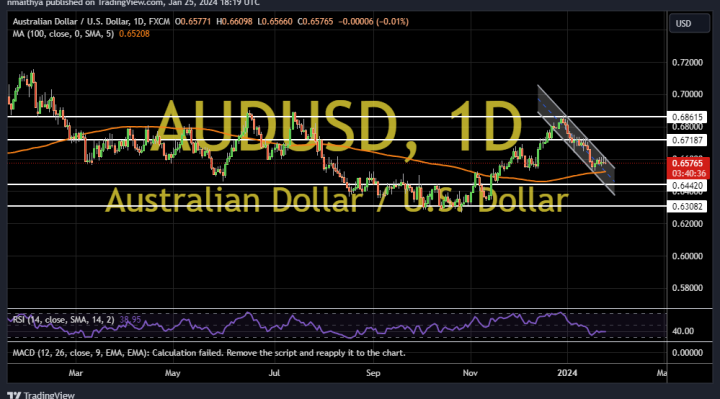
In the daily chart, the AUD/USD currency pair appears to be trading within a descending channel formation. The 14-day RSI also seems to support a bearish bias as it moves closer to oversold conditions.
Therefore, the bears will be targeting long-term profits at about 0.6442 or lower at 0.6308. On the other hand, the bulls will look to pounce on profits at about 0.6718 or higher at 0.6861.