
On Thursday, the AUD/USD currency pair pulled back from the session highs of about 0.7136 to trade at about 0.7085. The currency pair trades within a descending channel formation in the 60-minute chart.
The pair has now fallen to trade slightly below the 100-hour moving average line, after the latest pullback. As a result, the currency pair is on the verge of entering the oversold levels of the 14-hour RSI.
AUD/USD Fundamentals Overview

From a fundamental perspective, the AUD/USD currency pair trades during a relatively busy period in the US market. On Thursday, the US initial jobless claims for last week came in better than expected, with 213k versus a forecast of 215k, down from the previous week’s claim count of 214k.
Housing starts for January also came in better than expected, with 1.487 million versus 1.35 million, up from the previous month’s equivalent of 1.387 million. On the other hand, building permits for the month missed the expectation of 1.41 million, with 1.376 million down from 1.455 million in December.
Earlier in the week, the US consumer price index for February matched the (MoM) forecast of 0.3%, up from 0.2% in January. The (YoY) equivalent was also in line with the estimate of 2.4%, unchanged from the preceding month. The consumer price index ex-food and energy matched the forecasted (MoM) and (YoY) changes of 0.2% and 2.5%, respectively.
Looking forward, traders will be waiting for the US personal consumption expenditure data for January and the durable goods orders data for the month on Friday.
AUD/USD Technical Analysis (the 60-min Chart)
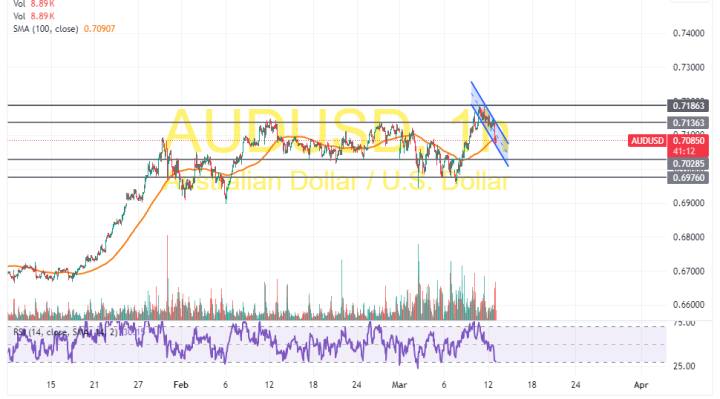
Technically, the AUD/USD currency pair trades within a descending channel formation in the 60-minute chart. The 14-hour RSI also supports a bearish bias as it edges closer to oversold conditions.
Therefore, the bears will look to stretch the latest pullback towards 0.7028 or lower to 0.6976. On the other hand, the bulls will look to pounce on rebounds at about 0.7136 or higher at 0.7186.
AUD/USD Technical Analysis (the Daily Chart)
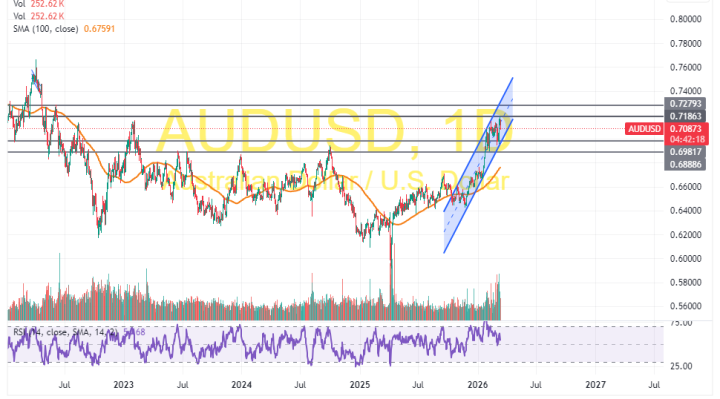
In the daily chart, the AUD/USD currency pair trades within an ascending channel formation. However, the 14-day RSI has recently pulled back to recover from overbought conditions.
Therefore, the bears will look to stretch the latest pullback towards 0.6981 or lower to 0.6888. On the other hand, the bulls will look to pounce on profits at about 0.7186 or higher at 0.7279.