
The AUD/USD currency pair on Friday pulled back off the trendline resistance at 0.6878 to trade at about 0.6841. The currency pair continues to trade within an ascending channel formation after bottoming earlier this week.
The pair has now rallied to trade several levels above the 100-hour moving average line in the 60-min chart. However, Friday’s pullback pushed the currency pair off overbought conditions back to the normal trading zone of the 14-hour RSI.
AUD/USD Fundamentals Overview

From a fundamental perspective, the AUD/USD currency pair is trading at the back of a relatively busy period in both markets. On Friday, the US wholesale inventories for July beat the expected change of 0.8% with a change of 0.6%. On Thursday, the initial jobless claims for last week outperformed the forecasted claim count of 140k with a lower tally of 222k.
On the other hand, the continuing claims missed 1.435 million with a higher tally of 1.473 million. Earlier in the week, the ISM Services PMI for August outshone the expectation of 55.1 with 56.9. On the other hand, the ISM Services Prices Paid missed 76.5 with 71.5, while both Employment Index and New Orders Index segments outperformed estimates.
In Australia, Trade Balance for July missed the expectation of 14.5 billion with 8.733 billion on Thursday, Earlier in the week, the Australian gross domestic product for Q2 missed the (QoQ) expectation of 1% with a change of 0.9%, while the (YoY) equivalent beat the consensus estimate of 3.5% with a change of 3.6%. The Reserve Bank of Australia raised the base interest rate by 50 basis points to 2.35% up from 1.85% in line with expectations.
AUD/USD Technical Analysis (the 60-min Chart)
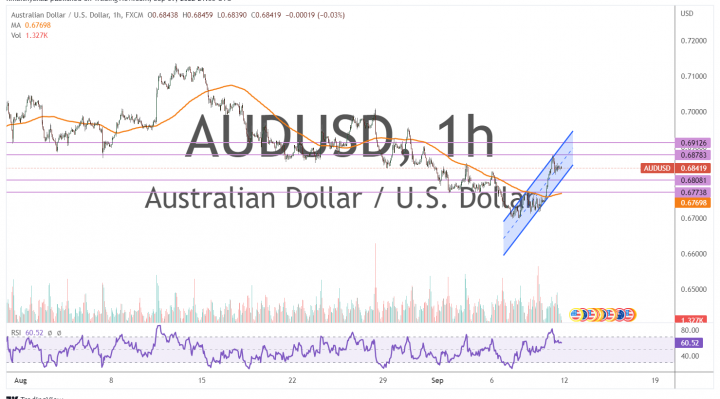
Technically, the AUD/USD currency pair seems to be trading within an ascending channel formation in the 60-min chart. This indicates a significant short-term bullish bias in the market sentiment.
Therefore, the bulls will be targeting short-term profits at about 0.6878 or higher at 0.6912. On the other hand, the bears will look to pounce on profits at about 0.6808 or lower at 0.6773.
AUD/USD Technical Analysis (the Daily Chart)
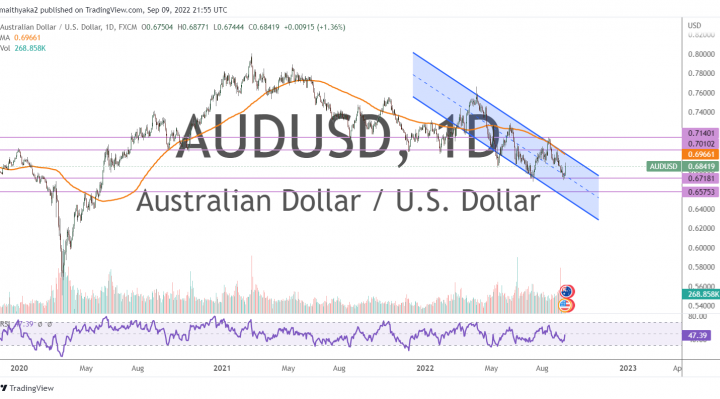
In the daily chart, the AID/USD currency pair appears to be trading within a descending channel formation. This indicates a significant long-term bearish bias in the market sentiment.
Therefore, the bears will be looking to stretch the current declines toward 0.6718 or lower to 0.6575. On the other hand, the bulls will look to pounce on profits at about 0.7010 or higher at 0.7140.