
The AUD/USD currency pair on Thursday pulled back off the current weekly highs of about 0.7470 to trade at about 0.7370 after the US data. The currency pair appears to have completed a downward breakout from an ascending channel in the 60-min chart.
As a result, the currency [air has plummeted to trade below the 100-hour moving average line. However, the pair mounted a late rebound preventing it from declining deep into the oversold levels of the 14-hour RSI.
AUD/USD Fundamentals Overview

From a fundamental perspective, the AUD/USD currency pair is trading at the back of a relatively busy period in the US market. On Thursday, the US initial jobless claims for the week ending April 15 missed the expected claim count of 180k with a higher tally of 184k.
On the other hand, continuing claims for the period ended April 8 outshone the consensus estimate of 1.455 million with a lower claim count of 1.417 million. Elsewhere, the Philadelphia Fed Manufacturing Survey for April missed the expected count of 21 with a lower figure of 17.
Earlier in the week, the US building permits for March beat the expected (MoM) tally of 1.825 million with a high figure of 1.873 million, while housing starts for the same period outshone 1.745 million with 1.793 million.
In Australia, the Westpac leading index for March grew by 0.35% compared to the previous growth rate of 0.38% (MoM).
AUD/USD Technical Analysis (the 60-min Chart)
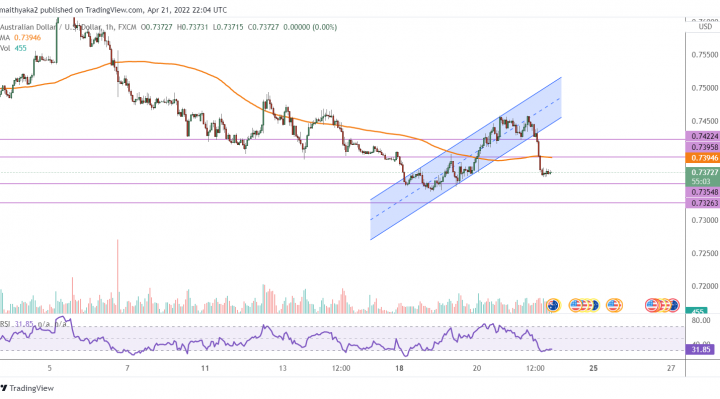
Technically, the AUD/USD currency pair seems to have recently plummeted to complete a downward breakout from an ascending channel formation. This indicates a sharp change in the market sentiment from bullish to bearish.
Therefore, the bears will be looking to extend the current plunge towards 0.7354 or lower to 0.7326. On the other hand, the bulls will be targeting short-term rebound profits at about 0.7395, or higher at 0.7422.
AUD/USD Technical Analysis (the Daily Chart)
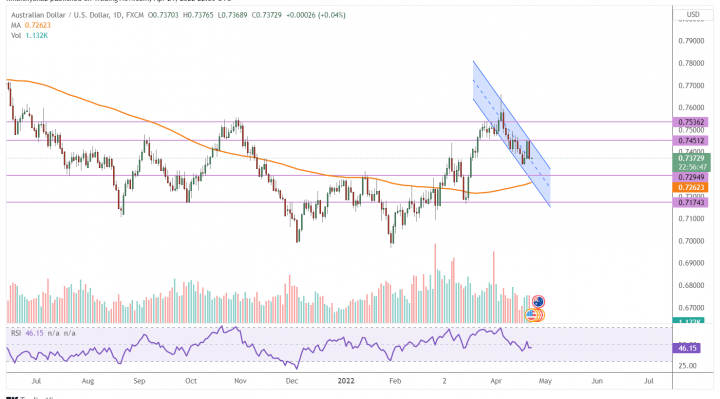
In the daily chart, the AUD/USD currency pair seems to be trading within a descending channel formation. This indicates a significant long-term bearish bias in the market sentiment.
Therefore, the bears will be looking to ride the current downward trend towards 0.7295 or lower to 0.7174. On the other hand, the bulls will be targeting potential long-term reversals at about 0.7451, or higher at 0.7536.