
The AUD/USD currency pair on Friday extended the current weekly gains towards 0.6200 amid the weakening of the US dollar. The currency pair is trading on a consolidative bullish triangle formation, which could culminate in a breakout.
The pair’s recent rally has taken it towards the resistance trendline of the triangle, which could spark a short-term pullback. The 60-min RSI also indicates that the pair is now close to crossing over to overbought levels.
AUD/USD Fundamentals Overview

From a fundamental perspective, the AUD/USD currency pair is trading at the back of a tumultuous period in the global financial markets. The coronavirus pandemic continues to exert pressure on businesses as governments implement border shutdowns to limit the spread. This could continue for a while until the world gets on top of the deadly virus. As such, a lack of normal business operations will continue to put a strain on global economies.
The latest US economic data points towards just that. The non-defense capital goods orders ex-aircraft for February missed the expectation of -0.4% with -0.8%. On the other hand, durable goods orders ex-transportation came short of -0.4% with -0.6%. The preliminary Markit Manufacturing PMI for March impressed with 49.2 versus an expectation of 42.8. However, the Services PMI disappointed with 39.1, missing the estimate of 42. Jobless claims also came in heavier than expected with 3.283M claims versus 1M.
In Australia, Commonwealth Bank Services PMI for March missed the expectation of 48.3 with 39.8 while the Bank manufacturing PMI beat 50 with 50.1.
AUD/USD Technical Analysis (the 60-min Chart)
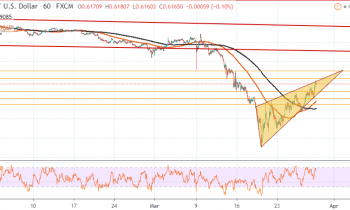
Technically, the AUD/USD currency pair appears to be trading under strong short-term bullish pressure. The pair is pegged within a consolidative ascending triangle, which could lead to a breakout.
Therefore, the bulls will be targeting short-term profits at around 0.6222 or higher at 0.6300. On the other hand, the bears will look to target short-term pullback profits at round 0.6086 or lower at 0.6000.
AUD/USD Technical Analysis (the Daily Chart)
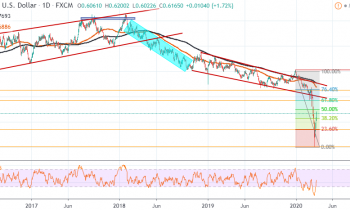
In the daily chart, the AUD/USD currency pair appears to have recently rebounded after it plunged to trade at new historical lows of 0.5507. The rebound has now put it close to the 50% fib level.
The bulls will target long-term profits at 61.80% Fib level at 0.6423 or higher at 76.40% Fib level at 0.6630. On the other hand, the bears will target profits at 23.60% Fib level at 0.5849 or lower at 0.00% Fib level at 0.5507.