
The AUD/USD currency pair continues to consolidate in a bearish channel amid renewed optimism in the US market as the trade war with China takes a breath. The currency pair’s bearish movement comes after a long period of sideways movement ended with a sharp rebound earlier this week.
The 100-hour and the 200-hour moving average lines are positioned above the currency pair’s current level, which illustrates the current bearish pressure. The current trend could continue through next week since the RSI indicator in the 60-min chart shows that the recent rebound is yet to drive the pair to overbought levels.
AUD/USD Fundamentals Overview

From a fundamental perspective, the AUD/USD currency pair is trading at the back of less turbulent week compared to the previous two. On Friday, US personal spending for July beat expectations with 0.6% growth versus 0.5%.
On the other hand, Core Personal Consumption Expenditure was in line with expectations for July with 1.6% change (YoY) and 0.2% (MoM). However, personal income missed with 0.1% growth versus a forecast of 0.3%.
The Chicago Purchasing Manager’s Index for August beat expectations with 50.4 points versus 47.5 points while the Michigan Consumer Sentiment Index for the same month fell short of expectations with 89.8 points versus 92.1.
The Aussie continues to experience pressure after Building Permits for July fell by 28.5% (YoY) down from a 25% decline in the previous period. The month over month change missed expectations of 0.0% with -9.7%.
AUD/USD Technical Analysis (the 60-min Chart)

Technically, the AUD/USD currency pair appears to be trading in a downward trending channel, which indicates a short-term bearish bias. The support trendline of the channel intersects with another bullish trendline in the 60-min chart, which indicates the existence of a strong support zone.
This level triggered the latest rebound, which has taken the pair to challenge the resistance trendline. The bulls will target short-term profits above this trendline at 0.6753 and 0.6779 while the bears will pounce at 0.6704 and 0.6677.
AUD/USD Technical Analysis (the Daily Chart)
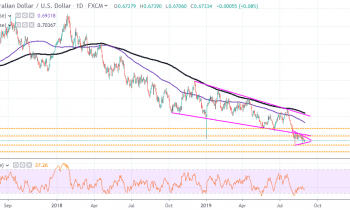
In the daily chart, the AUD/USD currency pair appears to be experiencing bearish pressure in a descending channel that dates back to October last year. The bearish bias can be seen extending back to 2017.
Recently, the pair has started to consolidate in a triangular formation, which could trigger a major breakout. This creates long-term opportunities for the bulls around 0.6866 while the bears will e targeting profits at 0.6677.
In summary, the AUD/USD currency pair appears to be experiencing bearish pressure both long-term and short-term. However, the consolidative pattern formation could trigger a major breakout for the current trend.