
The AUD/USD currency pair is consolidating within a 20-pip range, which suggests that the current downward momentum may be suffering exhaustion. Since the start of the month, the pair has demonstrated what technical analysts would describe as a volatile sideways movement.
AUD/USD Fundamental Analysis
The AUD/USD traded lower close to 2-month lows early on Tuesday after strong economic data from the US. However, those losses were recouped later n the day with the pair gaining to trade closer to monthly highs. The pair is leaning on the softening of the US-China trade talks, which seems to be pointing towards a positive agreement.

However, while a stronger Chinese economy will boost the Aussie, the Reserve Bank of Australia’s (RBA) decision to hold rates steady at 1.5% will provide an anchor to any gains made against the greenback. The US ISM non-Manufacturing PMI came out strongly for February rising to 59.7% while New Home Sales beat expectations by posting 651k units, a significant improvement from January.
AUD/USD Technical Analysis (the 60-min Chart)
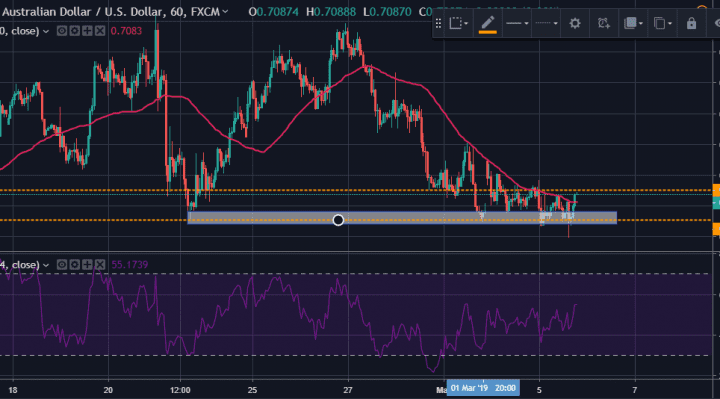
The AUD/USD currency pair just bounced off a key support zone at around 0.7070 after the declines made earlier on Tuesday. It now looks headed for a retest of the resistance at around 0.7090.
This range gives both the bears and the bulls some interesting short-term trading opportunities with the support and resistance levels acting as potential targets for profits, respectively. The 50-period moving average (MA) also provides a stronger basis for a downward movement following the rebound later on Tuesday.
AUD/USD Technical Analysis (the Daily Chart)
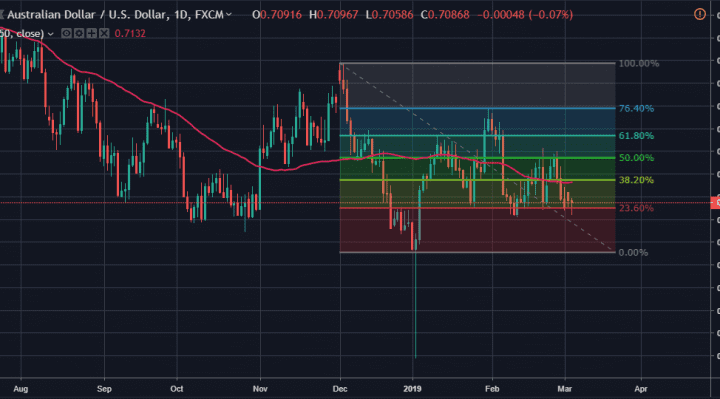
When w try to expand the view using the daily chart, it becomes clear that the downward momentum, although facing exhaustion, still holds. The AUD/USD currency pair seems to be trading off the 23.60% Fib level, which also acts as a support zone.
The bulls will be hoping for a rebound, in which case the 38.20% Fib level will provide a good target for profits. And if the pair is to hit February highs again, then the 50.00% Fib level could also be a realistic target for the bulls. On the other hand, the bears will be hoping that they maintain control by driving the pair lower below the 23.60% Fib level, which will create a new target for them at around 0.7000.
In summary, the AUD/USD currency pair appears to be suffering downward exhaustion from a technical perspective and this could trigger a short-term rebound based on the daily chart. The 60-min chart seems to turn the tables in favor of the bears following Tuesday’s late resurgence.