
On Friday, the AUD/USD currency pair failed to extend Thursday’s gains after forming a sideways trading pattern around 0.6525. The currency pair trades within an ascending channel formation in the 60-minute chart.
The pair continues to trade slightly above the 100-hour moving average line. However, the currency pair still has plenty of room left before reaching the overbought levels of the 14-hour RSI.
AUD/USD Fundamentals Overview

From a fundamental perspective, the AUD/USD currency pair trades during a relatively busy period in both markets. On Thursday, the Australian trade balance for June came in higher than expected, with 5,365 million versus a forecast of 3,250 million, up from the previous month’s equivalent of 1,604 million. Earlier in the week, the Australian S&P Global Services PMI for July came in stronger than expected, with 54.1 versus a forecast of 53.8.
In the U.S., the initial jobless claims for the week ending August 1 came in higher than the expectation of 221k, with a tally of 226, up from the previous week’s equivalent claim count of 218k. The preliminary nonfarm productivity for Q2 also fell short of 2.5% with a change of 2.4%, while the preliminary unit labor costs for the quarter beat the expectation of 1.5% with a change of 1.6%.
Earlier in the week, the U.S. ISM Services PMI for July missed the expected reading of 51.5 with a reading of 50.1. On the other hand, the S&P Global Composite PMI for the period outshone the forecast of 54.6 with a reading of 55.1, while the factory orders for June outshone the forecasted (MoM) change of -4.9% with a change of -4.8%.
AUD/USD Technical Analysis (the 60-min Chart)
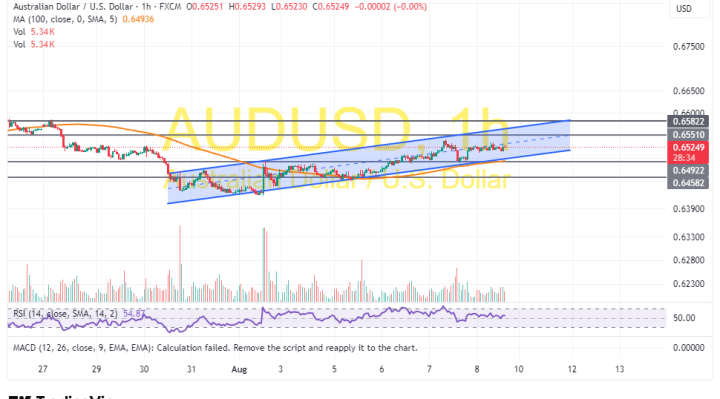
Technically, the AUD/USD currency pair trades within an ascending channel formation in the 60-minute chart. However, the 14-hour RSI still has room left to run before reaching overbought conditions.
Therefore, the bulls will look to stretch the current gains toward 0.6551 or higher to 0.6582. On the other hand, the bears will look to pounce on pullbacks at about 0.6492 or lower at 0.6558.
AUD/USD Technical Analysis (the Daily Chart)
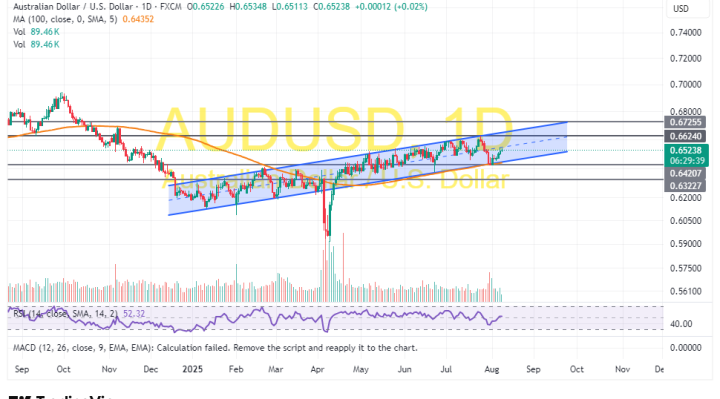
In the daily chart, the AUD/USD currency pair trades within an ascending channel formation. The 14-day RSI has also recently bounced back to support the bullish bias in the market sentiment.
Therefore, the bulls will look to ride the current run of gains towards 0.6624 or higher to 0.6725. On the other hand, the bears will look to pounce on pullbacks at about 0.6420 or lower at 0.6322.