
AUD/USD plunged since the end of the Asian session and looks determined to hit fresh new lows in the upcoming days. Technically could drop further because it looks too heavy to be stopped. Has turned to the downside after the false breakout above a strong confluence area, technically should drop further, but only if the dollar index will have enough energy to resume the minor rebound.
The USDX climb much above the 92.49 static support, maybe we had only a false breakdown below it and the rate will climb much higher again.

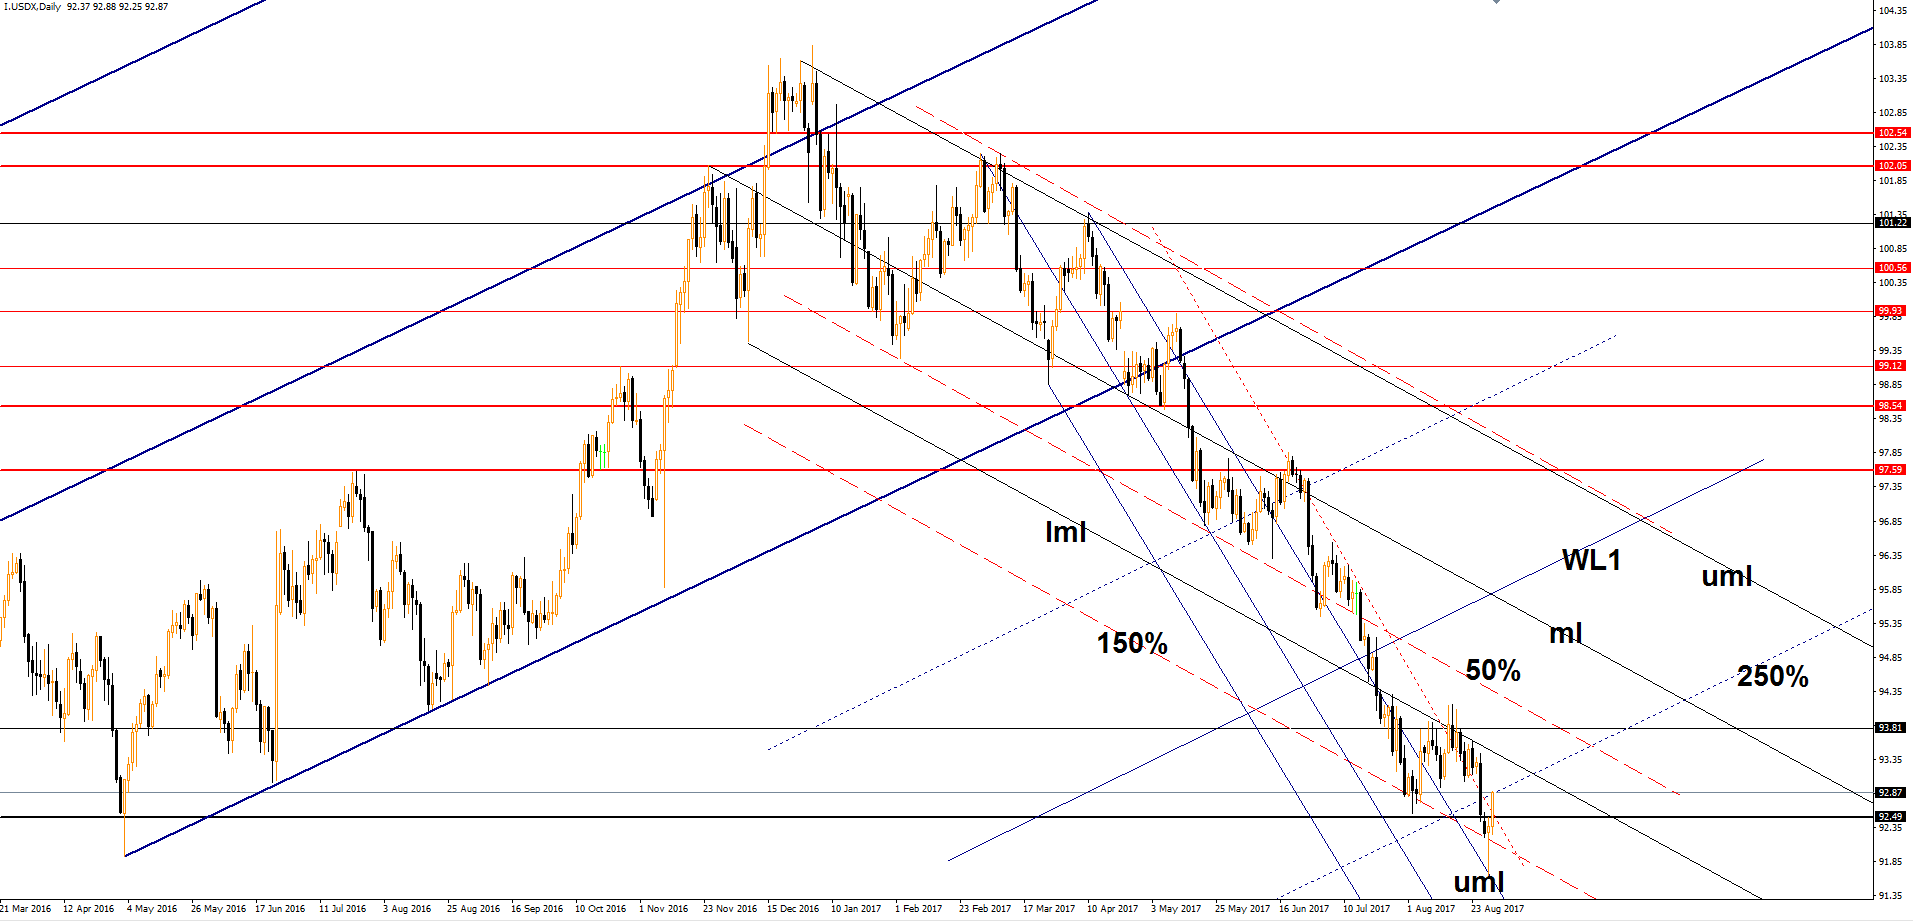
I’ve added the USDX’s chart to show you better what’s happening with the USD and why has rallied versus its rivals. You can see that has retested the upper median line (uml) of the minor descending pitchfork, but closed above the 150% Fibonacci line (descending dotted line), signaling that the bears are exhausted.
Is pressuring the 250% Fibonacci line (ascending dotted line), but the main target is at the lower median line (lml) of the descending pitchfork. You can see that is trapped between the lower median line (lml) and the 150% Fibonacci line. Technically is somehow expected to climb much higher after the failure to close on the lower median line (lml).
The Aussie increased in the morning only because the Australian data have come in better than expected, the Building Approvals dropped by 1.7%, less versus the 5.4% estimate, actually has plunged after the 11.7% growth in the former reading period. Moreover, the Construction Work Done rose by 9.3%, beating the 0.9% estimate and the 0.9% growth in the former reading period.
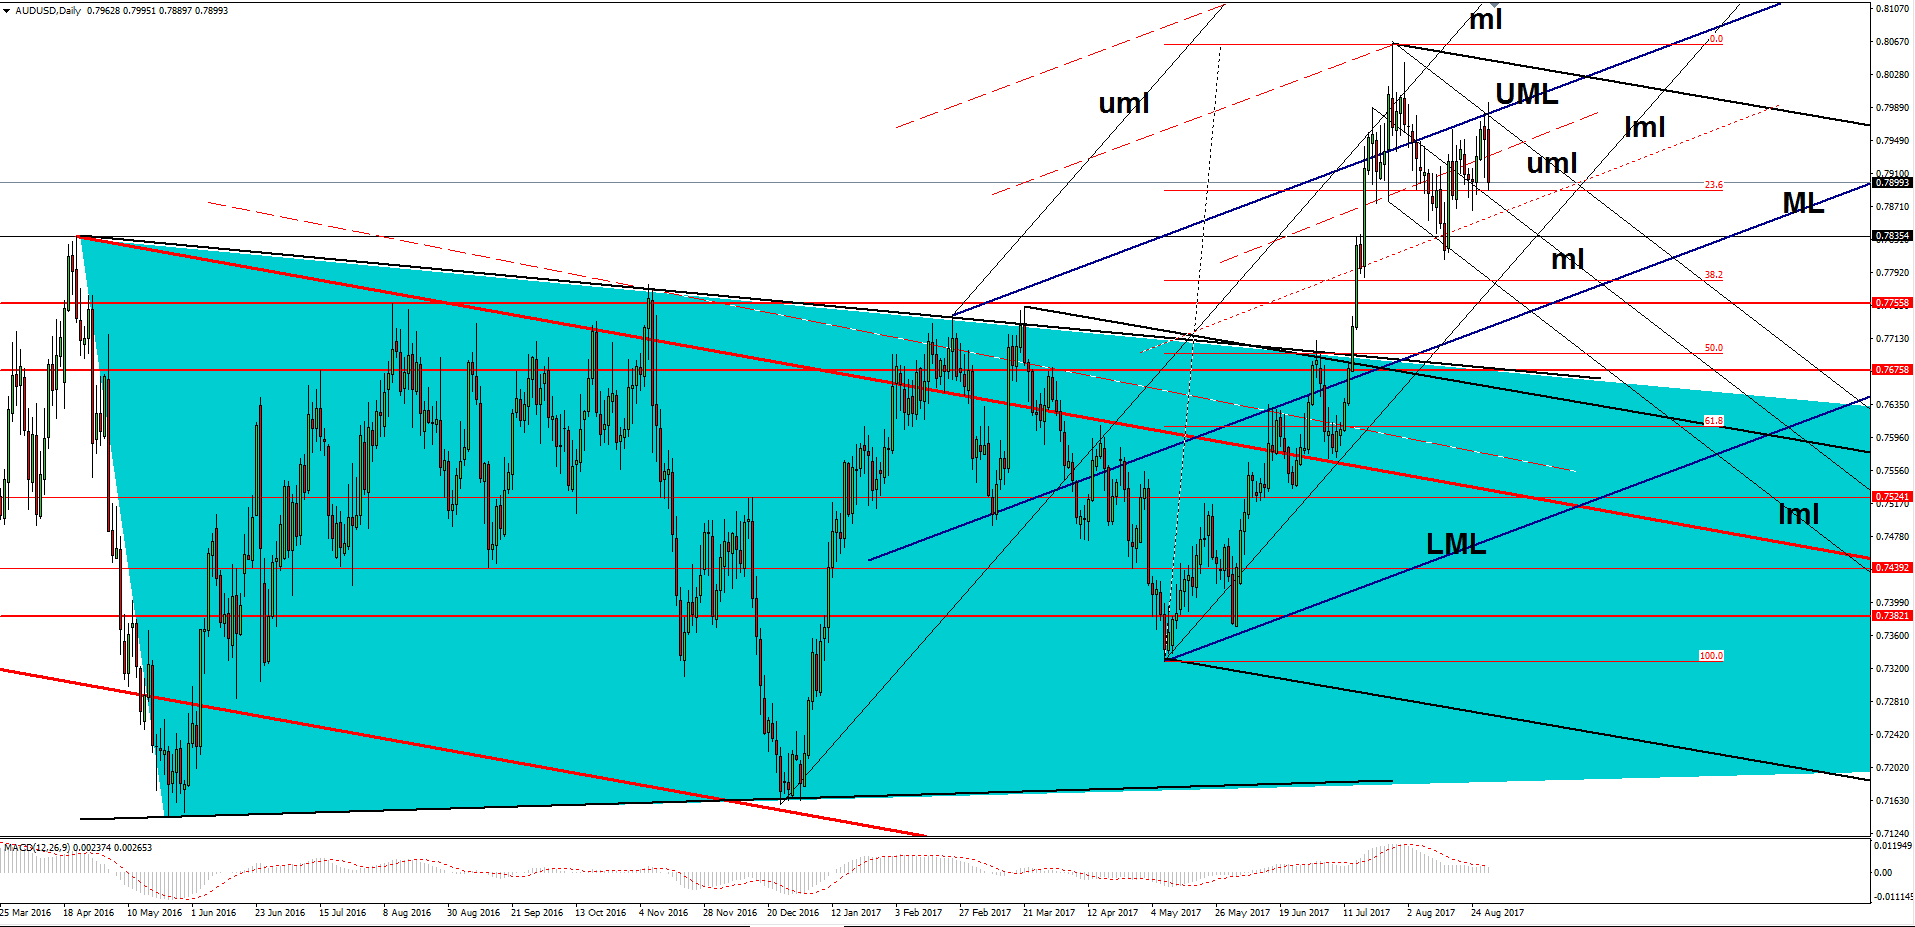
Price edges lower after the false breakout above the confluence area formed between the upper median line (UML) with the upper median line (uml) of the minor descending pitchfork. Will drop further as long as will stay within the descending pitchfork’s body. The failure to close on the confluence area signaled that the price is too exhausted on the daily chart and a corrective phase will appear again.
A larger drop will be validated after a breakdown below the median line (ml) of the minor descending pitchfork and below the 50% Fibonacci line (ascending dotted line).