
On Friday, the Bitcoin price bounced from its current multi-month lows of about $60,290 to trade at about $68,640 after the latest data. The BTC/USD trades within a descending channel formation in the 60-minute chart.
The price of the pioneer cryptocurrency continues to trade below the 100-hour moving average line, despite the latest rebound. Friday’s rebound helped it recover from the oversold levels of the 14-hour RSI.
Bitcoin Price Fundamentals Overview

From a fundamental perspective, the BTC/USD trades during a relatively busy period in the U.S. market. Bitcoin is experiencing pressure amid uncertainties surrounding Trump’s nomination of Kevin Warsh to replace Jerome Powell as the new Federal Reserve Chair. The pioneer cryptocurrency is also experiencing pressure amid increasing Spot Bitcoin ETF outflows, which inevitably requires issuers like BlackRock’s IBIT to sell an equivalent amount.
In the latest US economic data, the preliminary Michigan Consumer Sentiment Index for February outperformed the expectation of 55, with a reading of 57.3, up from 56.4 in January.
On Thursday, the JOLTS job openings for December fell short of the forecasted reading of 7.2 million, with a reading of 6.542 million, down from the previous month’s equivalent of 6.928 million. On the other hand, the initial jobless claims for last week rose to 2.31k, up from 209k in the preceding week, missing the forecasted claim count of 212k.
Earlier in the week, the ISM Services PMI for January exceeded the expectation of 53.5, with a reading of 53.8, unchanged from December.
Bitcoin Price Technical Analysis (the 60-min Chart)
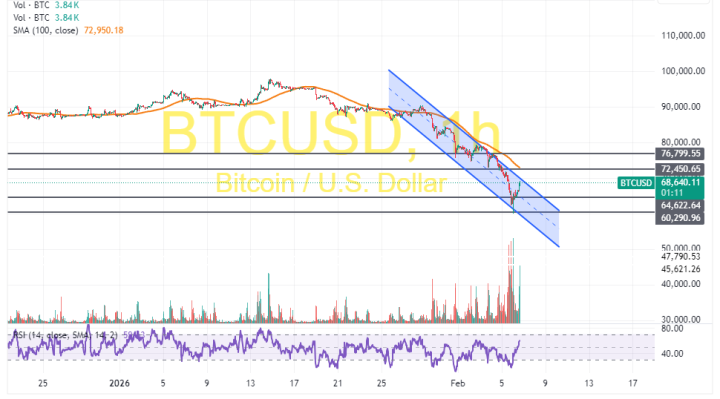
Technically, the Bitcoin price trades within a descending channel formation in the 60-minute chart. However, the 14-hour RSI has recently bounced back to avoid falling into oversold conditions.
Therefore, the bulls will look to stretch the latest rebound towards $72,450 or higher to $76,799. On the other hand, the bears will look to ride the current declines toward $64,622 or lower to $60,290.
Bitcoin Price Technical Analysis (the Daily Chart)
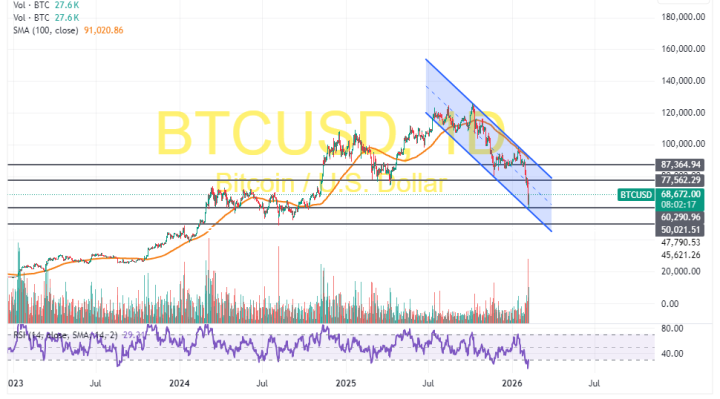
In the daily chart, the price of the pioneer cryptocurrency trades within a descending channel formation. The 14-day RSI also supports a bearish bias after entering oversold conditions.
Therefore, the bears will look to stretch the current downward movement towards $60,290 or lower to $50,021. On the other hand, the bulls will look to pounce on rebounds at about $77,562 or higher at $87,364.