
On Friday, the Bitcoin price bounced from the key support at about $97,567 to trade at about $101,005 after appointing a White House AI and Crypto Czar. The BTC/USD also completed an upward breakout from a sideways channel formation.
The price of the pioneer cryptocurrency has now advanced to trade a few levels above the 100-hour moving average line. As a result, Bitcoin is on the verge of entering the overbought levels of the 14-hour RSI.
Bitcoin Price Fundamentals Overview

From a fundamental perspective, the BTC/USD trades during a relatively busy period in the U.S. market. On Thursday, U.S. President-Elect Trump appointed former PayPal executive David Sacks as the White House AI and Crypto Czar.
The announcement came just days after Trump nominated former Securities and Exchange Commissioner Paul Atkins to replace Gary Gensler as the new SEC Chair. All these appointments are in line with Trump’s pre-election campaign that he will form a pro-crypto administration.
In the latest U.S. economic data, the U.S. nonfarm payrolls for November beat the forecasted tally of 200k with a tally of 227k, up from 36k in October. The unemployment rate for the month matched the forecast of 4.2%, up from 4.1%.
On the other hand, the average hourly wage growth for the period came in stronger than expected with a (MoM) change of 0.4% versus a forecast of 0.3%, while the (YoY) equivalent beat 3.9% with a change of 4%. Elsewhere, the preliminary Michigan Consumer Sentiment Index for December outshone the forecast of 73 with a reading of 74, up from 71.8.
Bitcoin Price Technical Analysis (the 60-min Chart)
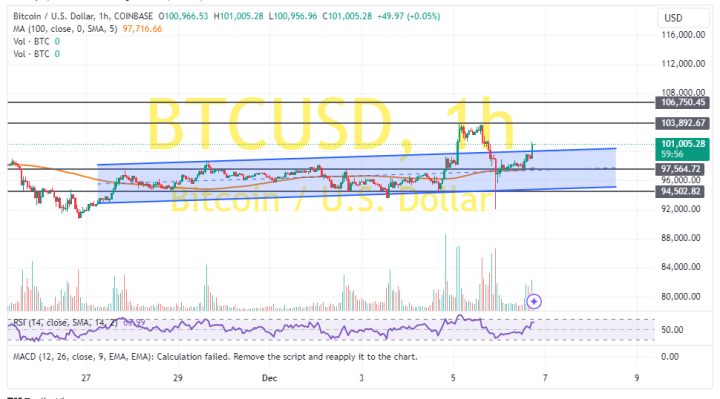
Technically, the Bitcoin price has completed an upward breakout from a sideways channel formation. The 14-hour RSI also supports a short-term bullish bias as it edges closer to overbought conditions.
Therefore, the bulls will look to stretch the current rally towards $103,892 or higher to $106,750. On the other hand, the bears will look to pounce on pullbacks at about $97,564 or lower at $94,502.
Bitcoin Price Technical Analysis (the Daily Chart)
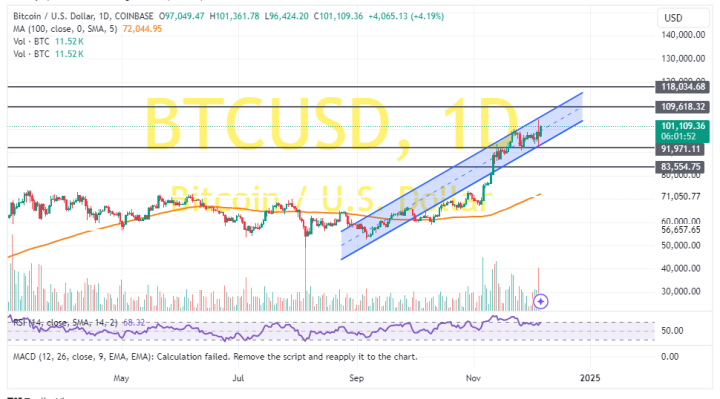
In the daily chart, the price of the pioneer cryptocurrency trades within an ascending channel formation. The 14-day RSI has also rallied closer to the overbought conditions.
Therefore, the bulls will look to ride the current run of gains toward $109,618 or higher to $118,034. On the other hand, the bears will look to pounce on pullbacks at about $91,971 or lower at $83,554.