
The price of bitcoin on Monday plunged from last week’s highs of about $61,800 to trade at around $55,300 before bounding back late to settle at $55,500. The price of the pioneer cryptocurrency has been extremely volatile in recent trading sessions despite maintaining a bullish outlook.
The BTC/USD continues to trade within an ascending channel formation in the 60-min chart. Monday’s pullback pushed it below the 100-hour SMA. However, it remains significantly higher above the 200-hour SMA. The late rebound pushed bitcoin off oversold levels of the 14-hour RSI back to the normal trading zone.
Bitcoin Price Fundamentals Overview

From a fundamental perspective, the BTC/USD appears to have pulled back in response to the new US stimulus package deal. The $1.9 trillion deal will inject more money into the economy thereby cushioning it against the adverse effects of the pandemic. This affects bitcoin negatively from the perspective of safe-haven investing. More investors will be putting money in capital assets like stocks at the expense of cryptocurrencies.
Bitcoin is also trading at times of uncertainty after reports emerged on Monday morning saying that India, the world’s second-most populous country plans to ban cryptocurrency trading and mining. This could take away a massive chunk of bitcoin’s addressable market, which would have an impact on the price. From a positive point of view, bitcoin and other cryptocurrencies continue to experience worldwide recognition as more mainstream companies embrace it.
Bitcoin Price Technical Analysis (the 60-min Chart)
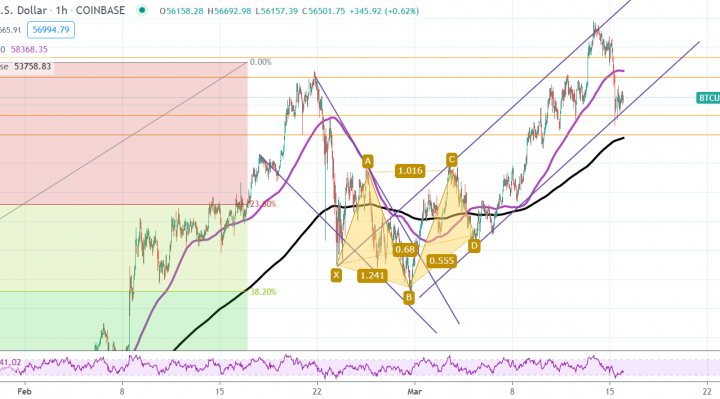
Technically, the price of the pioneer cryptocurrency appears to be trading within a sharply ascending volatile channel formation in the 60-min chart. This indicates a significant short-term bullish bias in the market sentiment.
The bulls will target short-term rebound profits at around $57,906 or higher at $59,267. On the other hand, the bears will look to extend Monday’s pullback towards $55,300 or lower to $53,960.
Bitcoin Price Technical Analysis (the Daily Chart)
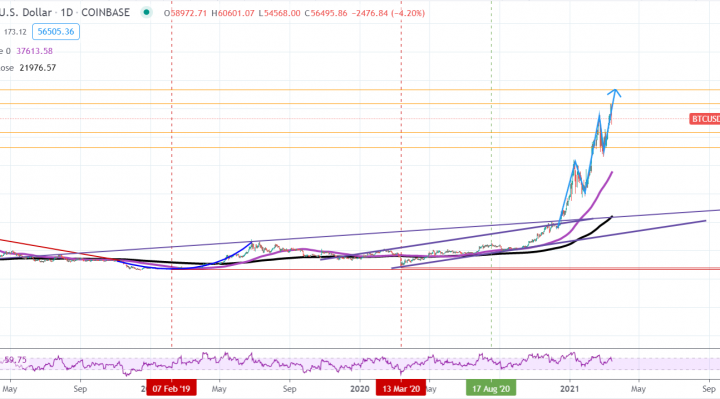
In the daily chart, the price of the pioneer cryptocurrency appears to be trading in a sharply rising curve formation. This indicates a strong long-term bullish bias in the market sentiment. Monday’s pullback prevented bitcoin from crossing to overbought levels of the 14-day RSI.
The bears will target long-term pullback profits at around $51,508 or lower at $46,252. On the other hand, the bulls will look to pounce for profits at around $61,721 or higher at $66,739.