
The bitcoin price on Wednesday bounced off the trendline support to trade at a new weekly high of about $22,484. The price of the pioneer cryptocurrency appears to be trading within an ascending channel formation in the 60-min chart.
Bitcoin has now surged to trade several levels above the 100-hour moving average line. As a result, bitcoin appears to be on the verge of entering the overbought levels of the 14-hour RSI.
Bitcoin Price Fundamentals Overview

From a fundamental perspective, bitcoin is trading at the back of a relatively busy period in the market. On Wednesday, the IM warned El-Salvador, the world’s biggest state investor in bitcoin of having too much exposure to bitcoin. A few hours later, news emerged that the Caribbean nation was planning to open a ‘Bitcoin Embassy’ in the US. The price of the pioneer cryptocurrency also appears to be benefitting from the rising popularity of bitcoin NFTs following the launch of Ordinals.
The BTC/USD’s current rally could also be boosted by the latest US data, which showed a slight decline in inflation, with the CPI registering a change of 6.4% (YoY) down from 6.5% in December. However, this was still higher than the market expectation of 6.2%. Looking forward, traders will be watching Wednesday’s retail sales data at 13:30 GMT, with analysts expecting a significant improvement from the previous period.
Bitcoin Price Technical Analysis (the 60-min Chart)

Technically, the bitcoin price appears to be trading within an ascending channel formation in the 60-min chart. This indicates a significant short-term bullish bias in the market sentiment.
Therefore, the bulls will be looking to build on the current gains by targeting profits at about $22,722 or higher at $23,025. On the other hand, the bears will look to pounce on profits at about $22,229 or lower at $21,912.
Bitcoin Price Technical Analysis (the Daily Chart)
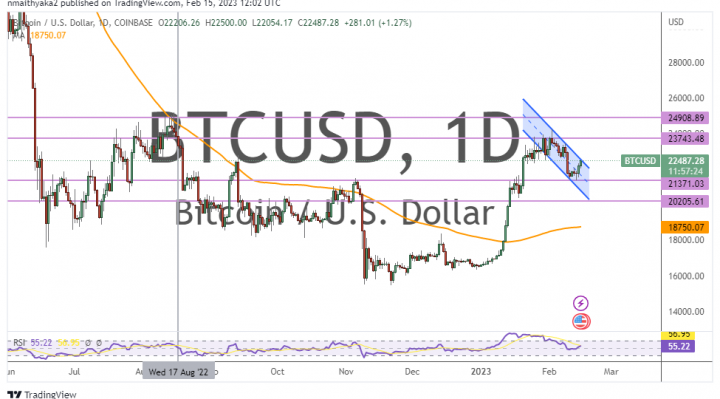
In the daily chart, the bitcoin price appears to be trading within a descending channel formation. This indicates a significant long-term bearish bias in the market sentiment.
Therefore, the bears will be looking to ride the current wave of declines toward $21,371 or lower to $20,205. On the other hand, the bulls will be targeting long-term profits at about $23,743 or higher at $24,908.