
On Friday, the Bitcoin price continued sideways movement around $121,255 after bouncing back from Thursday’s lows of about $119,835. The BTC/USD trades within a descending channel formation in the 60-minute chart.
The price of the pioneer cryptocurrency continues to trade slightly below the 100-hour moving average line, despite the latest rebound. As a result, it has room left to run before reaching the overbought levels of the 14-hour RSI.
Bitcoin Price Fundamentals Overview

From a fundamental perspective, the BTC/USD trades during a relatively busy period in the U.S. market. Earlier in the week, US MBA mortgage applications fell by 4.7% compared to a decline of 12.7% in the previous update. RealClearMarkets/TIPP Economic Optimism for October missed the (MoM) expectation of 49.3 with a reading of 48.3, down from 48.7.
The redbook index posted a slightly lower change of 5.8% (YoY) versus 5.9% in the previous update, while the consumer credit change for August missed the expectation of $13.5 billion with a change of $0.36 billion, down from $18.05 billion in July.
Looking forward, traders will be waiting for the preliminary U.S. consumer expectations and consumer sentiment index data for October on Friday. The preliminary UoM 1-year and 5-year consumer inflation expectations for the month will also be announced later in the day.
The BTC/USD is also being affected by the U.S. economic shutdown, which is now stretching further into next week.
Bitcoin Price Technical Analysis (the 60-min Chart)
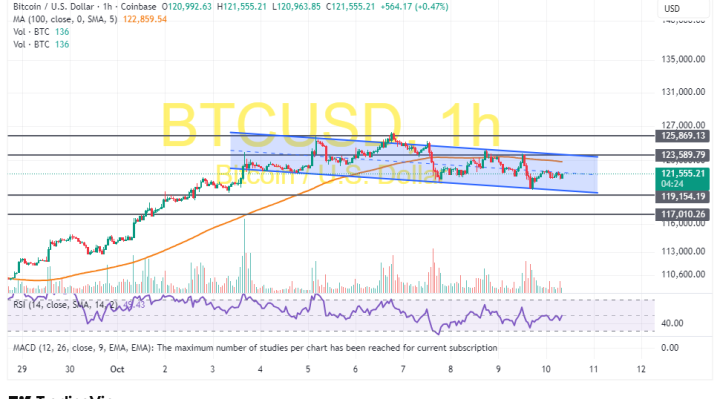
Technically, the Bitcoin price trades within a descending channel formation in the 60-minute chart. However, the 14-hour RSI has recently bounced back to avoid falling into oversold conditions.
Therefore, the bulls will look to extend the current rebound towards $123,589 or higher to $125,869. On the other hand, the bears will look to pounce on profits at about $119,154 or lower at $117,010.
Bitcoin Price Technical Analysis (the Daily Chart)
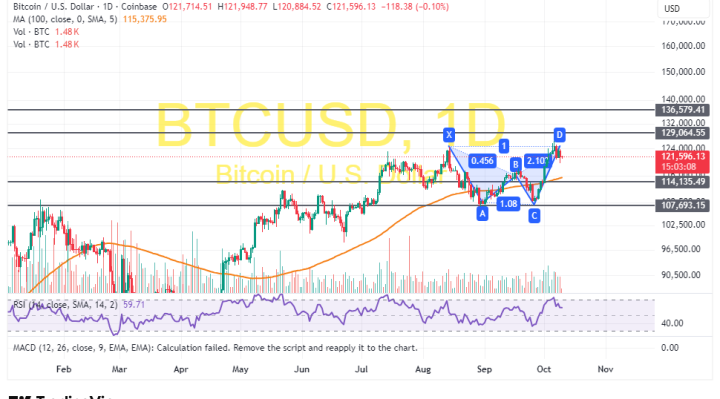
In the daily chart, the price of the pioneer cryptocurrency has recently completed a double-bottom reversal pattern formation. However, the 14-day RSI has pulled back to avoid rallying into overbought conditions.
Therefore, the bears will look to stretch the current pullback towards $114,135 or lower to $107,693. On the other hand, the bulls will look to pounce on profits at about $129,064 or higher to $136,579.