
On Friday, the Bitcoin price extended Thursday’s pullback to trade at about $114,608 after the latest round of data. The BTC/USD trades within a descending channel formation in the 60-minute chart.
The price of the pioneer cryptocurrency has now plummeted to trade a few levels below the 100-hour moving average line. As a result, Bitcoin continues to trade closer to the oversold levels of the 14-hour RSI.
Bitcoin Price Fundamentals Overview

From a fundamental perspective, the BTC/USD trades during a relatively busy period in the U.S. market. On Friday, the U.S. jobs data for July came in at 73k, missing the forecasted net change of 110k. The unemployment rate also edged slightly higher to 4.2%, up from 4.1%, in line with expectations. On the other hand, the average hourly wage growth for the month matched the forecasted (MoM) change of 0.3%. The (YoY) equivalent beat the forecast of 3.8% with a change of 3.9%.
Elsewhere, the ISM Manufacturing PMI for July fell short of 49.5 with a reading of 48. The ISM Manufacturing Prices Paid also missed 70 with a reading of 64.8. The Michigan Consumer Sentiment Index for July fell short of the forecast of 62, with a reading of 61.7. The UoM 5-year consumer inflation expectation for the period also fell short of 3.6% with 3.4%.
Earlier in the week, the initial jobless claims for the week ending July 25 edged slightly higher to 218k, up from 217k, beating the forecasted claim count of 224k.
Bitcoin Price Technical Analysis (the 60-min Chart)
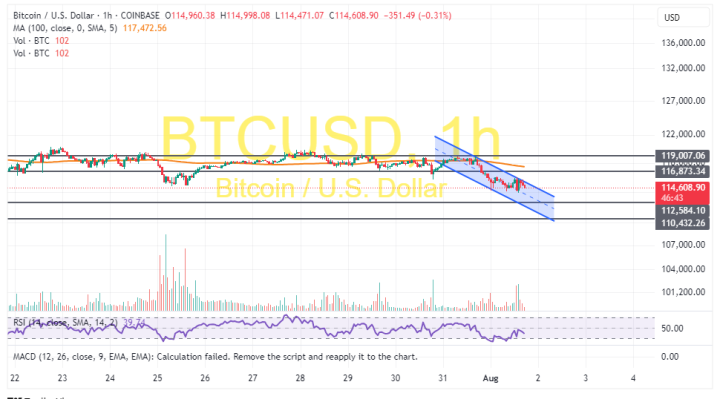
Technically, the BTC/USD trades within a descending channel formation in the 60-minute chart. However, the 14-hour RSI has recently bounced back to avoid descending into oversold conditions.
Therefore, the bulls will look to extend the current rebound towards $116,873 or higher to $119,007. On the other hand, the bears will look to pounce on profits at about $112,584 or lower at $110,432.
Bitcoin Price Technical Analysis (the Daily Chart)
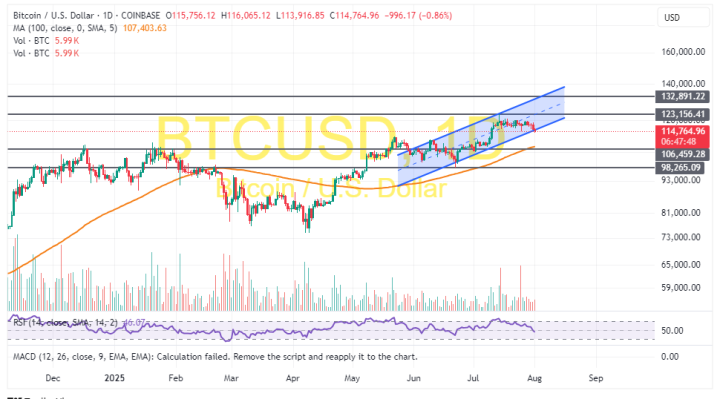
In the daily chart, the Bitcoin price trades within an ascending channel formation. However, the 14-day RSI has recently pulled back to avoid rallying into overbought conditions.
Therefore, the bears will look to extend the current pullback towards $106,459 or lower to $98,265. On the other hand, the bulls will look to pounce on profits at about $123,156 or higher at $132,891.