
On Friday, the Bitcoin price extended Thursday’s pullback to trade at about $91,422 ahead of the U.S. consumer spending data. The BTC/USD trades within a descending channel formation in the 60-minute chart.
However, the price of the pioneer cryptocurrency still trades slightly above the 100-hour moving average line, despite the pullback. As a result, it still has some room left to run before reaching oversold conditions.
Bitcoin Price Fundamentals Overview

From a fundamental perspective, the BTC/USD trades during a relatively busy period in the U.S. market. On Thursday, the U.S. initial jobless claims for last week fell to 191k, down from the preceding week’s equivalent of 218k, beating the forecast of 220k. On the other hand, factory orders for September fell short of the forecasted (MoM) change of 0.5%, with a change of 0.2%.
Earlier in the week, the ISM Services PMI for November outperformed the expected reading of 52.1, with a reading of 52.6, while the S&P Global Composite PMI for the period missed the forecast of 54.8, with a reading of 54.2. The ADP Employment Change for November also fell short of 5k, with a change of -32k, down from the preceding month’s equivalent of 47k.
The ISM Manufacturing PMI for November missed the expectation of 48.6, with a reading of 48.2, while the ISM Manufacturing Prices Paid for the month failed to match the forecast of 59.5, with a reading of 58.5.
Bitcoin Price Technical Analysis (the 60-min Chart)
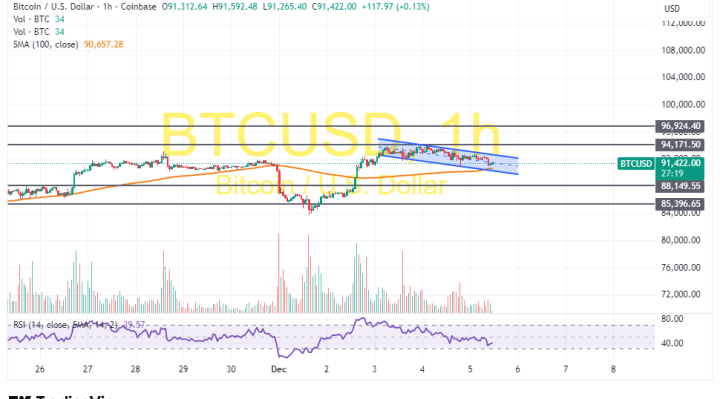
Technically, the Bitcoin price trades within a descending channel formation in the 60-minute chart. However, the 14-hour RSI still has room left to run before reaching the oversold levels of the 14-hour RSI.
Therefore, the bears will look to stretch the current pullback towards $88,149 or lower to $85,396. On the other hand, the bulls will look to pounce on profits at about $94,171 or higher at $96,924.
Bitcoin Price Technical Analysis (the Daily Chart)
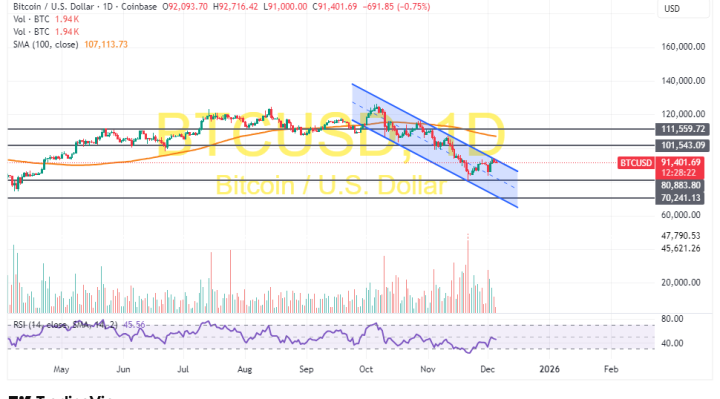
In the daily chart, the price of the pioneer cryptocurrency trades within a descending channel formation. However, the 14-day RSI has recently bounced back to recover from oversold conditions.
Therefore, the bulls will look to extend the current rebound towards $101,543 or higher to $111,559. On the other hand, the bears will look to pounce on profits at about $80,883 or lower at $70,241.